
This post was originally published on this site
By Ovi

While this post updates Non-OPEC production to January 2020, we are now in late May and the direction for future production for the next few years is clear, LOWER than where it was in March 2020. OPEC, in response to the reduced worldwide demand, arranged for a production reduction through a Declaration of Cooperation (DoC) with OPEC and Non-OPEC countries. Also Canada and Norway have indicated they will be cutting production in response to worldwide reduced demand. The OPEC + DoC reduction schedule and chart are shown and discussed at the end of this post.
Below are a number of oil (C + C) production charts for Non-OPEC countries created from data provided by the EIAʼs International Energy Statistics and updated to January 2020. Information from other sources, such as OPEC and recent news reports and country specific sites, is used to provide a short-term outlook for future output and direction for a few countries.
Note that Ecuador production has been removed from OPEC and moved to Non-OPEC and all affected charts have been back dated to January 2012.
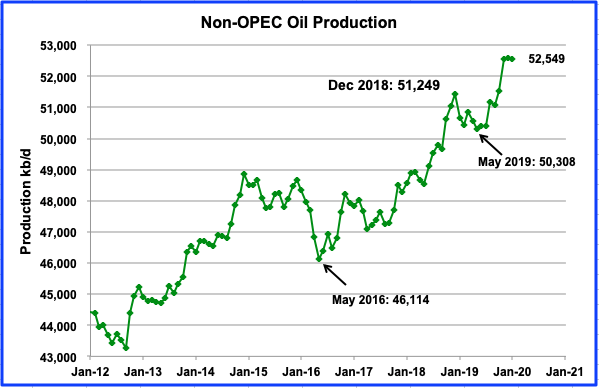
Non-OPEC production was essentially flat from November to January at an average production rate of 52,575 kb/d. January production was 52,549 kb/d and was down by 54 kb/d from December.
Decemberʼs 2019 production exceeded the previous high of 51,249 kb/d reached in December 2018 by 1,120 kb/d. Of this increase, the US contributed 766 kb/d. Smaller gains were provided by Norway, Brazil and Canada.
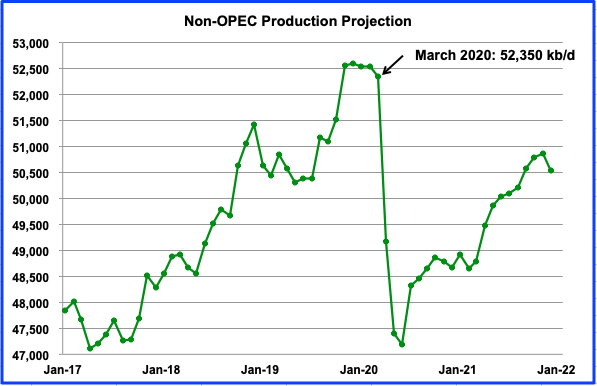
This chart uses the May STEO report along with the EIA’s International Energy Statistics to project Non-OPEC production out to December 2021. Production is predicted to drop from 52,350 kb/d in March 2020 to 47,193 kb/d in June 2020 for a total drop of 5,157 kb/d. Of the 5,157 kb/d drop, the main contributors are US (1.74), Canada (0.92), Mexico (0.17) and Former Soviet Union (1.77).
In December 2021, output is projected to recover to 50,545 kb/d, an increase of 3,352 kb/d over the June 2020 low. Of the 3,352 kb/d recovery, the contributors are US (0.36), Canada (0.97), other OECD and Non-OECD (0.56) and Former Soviet Union (1.47).
The December output of 50,545 kb/d is essentially 2,000 kb/d lower than March 2020. Of the 1,800 kb/d, US December 2020 output is 1,700 kb/d lower than March 2020. The question here is whether there will be a change of strategy/opinion in the US? Will the oil companies and drillers continue to challenge OPEC for supremacy or will they strive to maximize profit and spread out expenses? It is the answer to this strategy/opinion issue that raises the question “Are Non-OPEC’s best days in the rear-view mirror?”
Goldman Sachs also has a perspective on this question. “Goldman Sachs said it has identified a turning point in the oil and gas investment and production cycle that is arriving seven years after the 2014 oil-price peak which signaled the end of non-OPEC growth.”
To this question, add Rystad’s latest projection for Peak Demand. Global oil demand hit a record of just over 100 million barrels per day (bpd) in 2019. Rystad now sees demand topping out at 106.5 million-107 million bpd in 2027-2028. The consultancy had previously forecast a marginally higher peak in 2030.
Since all liquids supply was close to 101 Mb/d close to a year ago, where will the additional 6 Mb/d come from now that capex and exploration expenses are being reduced and stretched out?
In addition to the question of how production recovery will proceed, another issue is beginning to emerge. Over the past month, many companies have announced that they will be moving to a “Work from Home” policy in the US and Canada. This will have a significant impact on oil demand in both countries and could slow the rate at which oil companies try to recover lost production. In the May 15 EIA inventory report, gasoline demand was down by 2.6 Mb/d on a YoY basis.
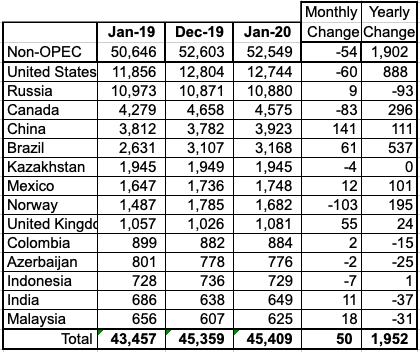
Above the worldʼs 14th largest Non-OPEC producers are listed. They produced 86.4% of the Non-OPEC output in January. Note on a YoY basis, Non-OPEC production was up by 1,902 kb/d while world oil demand was up by 1,000 kb/d.

Brazil production peaked in January at 3,168 kb/d. Production data for February and March were obtained from this source where it was reported that output dropped to 2,970 kb/d in February and March, a drop of 198 kb/d.
According to the April OPEC report, “Brazil’s crude oil output in February fell by 0.18 mb/d m-o-m to average 2.99 mb/d as the P-75 FPSO in Buzios operated at just one fifth of its 0.15 mb/d production capacity.” The drop continued in March. No indication was given if the low production was due to technical/mechanical issues with the FPSO.
According to the May 2020 OPEC report, “In early April, Petrobras agreed to reduce its oil production by 0.2 mb/d in response to the contraction of demand for oil and oil-related products. Brazil’s liquids production in 2020 is forecast to increase by 0.19 mb/d y-o-y to average 3.73 mb/d, revised down by 87 tb/d in the new forecast following their stipulation for a cut.”
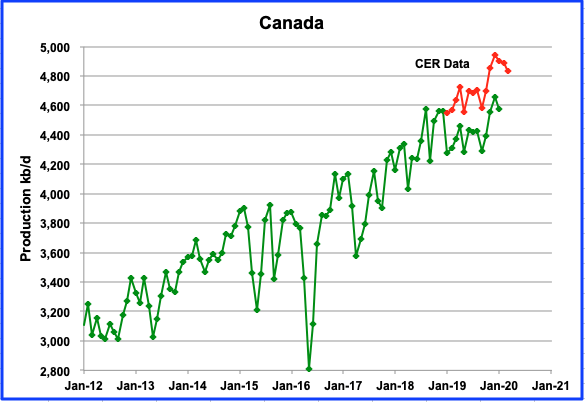
According to the Canada Energy Regulator, Canadian production will drop by 108 kb/d from December 2019 to March 2020 as shown by the separate red graph. Canadian oil exports are still constrained by pipeline capacity. In March 351 kb/d were shipped by rail, a drop of 61 kb/d from 412 kb/d in February.
On May 23, opponents of the Enbridge line 3 pipeline replacement petitioned the state utility regulator to reconsider its approval of the $2.6 billion project, citing the new different world.
In April a Montana court ruled against permitting the Keystone XL oil pipeline to proceed because the Army Corps violated federal law by failing to adequately consult on risks to endangered species and habitat.
According to this report, Canada’s oil production will be hard hit by the pandemic and will contribute to the DoC negotiated by OPEC and its partners.
“Canada oil sands continue to be the prime victim with 1.14 million bpd of shut-ins in April, followed by Iraq with around 300,000 bpd, and Venezuela with 275,000 bpd. The upstream shut-ins in our tracker primarily include involuntary shut-ins at fields which halted production due to low oil prices, the Covid-19 outbreak, or storage/offtake constraints.”
“In total, we estimate 2Q20 global outages from Covid-19, low prices, and storage constraints at 1.88 million bpd. With oil sands projects like Fort Hills, Mildred Lake/Aurora and Kearl shuttering production, Canada leads the tally with an expected loss of about 960,000 bpd over the quarter.”
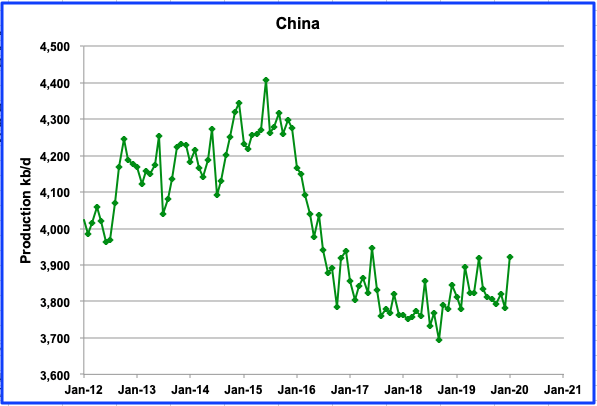
China’s production increased by 141 kb/d in January. The increase is due to Chinaʼs oil companies increasing spending and drilling to maintain and increase output.
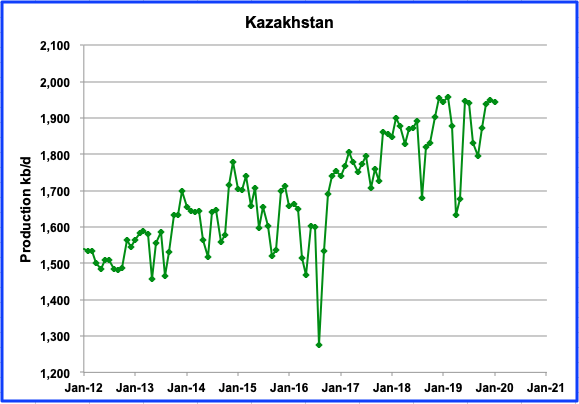
Kazakhstan appears to be on a plateau. From December 2018, production has peaked three times at close to 1,950 kb/d. January 2020 output was 1,946 kb/d. Production should drop in May since it is one of the Non-OPEC signatories to the OPEC DoC.
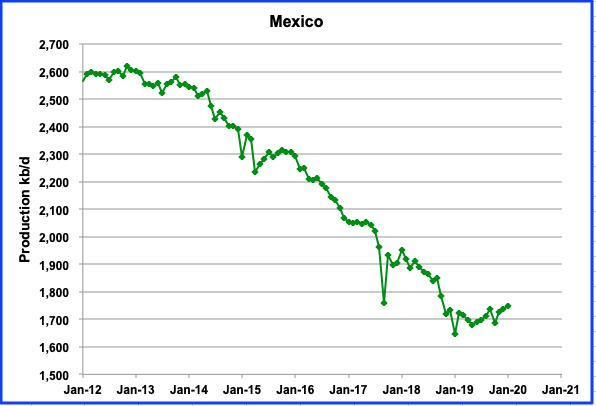
Mexico continues its slow steady output increase. In January production increased by 12 kb/d to 1,748 kb/d.
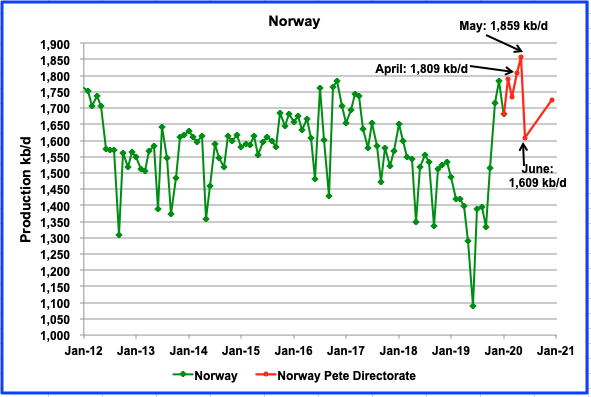
Norway’s output has been very volatile since December, varying up and down by close to 70 kb/d each month. Output in April, as reported by the Norwegian Petroleum Directorate, was at a new high of 1,809 kb/d, an increase of 74 kb/d over March.
As a result of the pandemic and in cooperation with OPEC + DoC, Norway has voluntarily agreed to cut its production according to the following schedule.
This cut is based on a reference production of 1,859,000 barrels of oil per day. A cut of 250,000 barrels a day in June 2020 thus yields an upper limit for oil production on the Norwegian shelf of 1,609,000 barrels a day in June. (This statement implies that Norway’s output in May will be 1,859 kb/d, an increase of 50 kb/d over April. The increase is probably expected from the newly commissioned Johan Sverdrup field. While its statement is inferring an output rise in May, the chart below, taken from the NPD’s latest production announcement, shows a decline in projected May output, red dots. Am I missing something here???)
“A cut of 134,000 barrels a day in the second half of 2020 will yield an upper limit for average oil production from the Norwegian shelf during the second half-year of 1,725,000 barrels a day”. (This increase is represented by the straight line from June 2020 to December 2020).
In a statement, the Minister of Petroleum and Energy Tina Bru said that “We will cut Norwegian oil production by 250,000 barrels per day in June, and by 134,000 barrels per day in the second half of the year. The start of production on multiple fields will also be postponed to 2021. Overall Norwegian production in December 2020 will amount to 300,000 barrels a day lower than the companies had planned. This regulation will cease at the end of the year.”
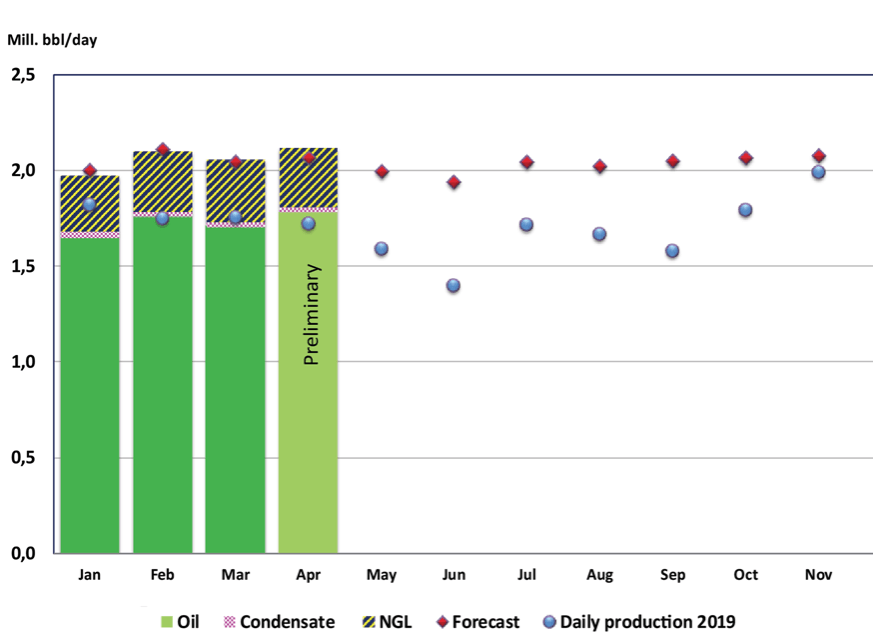
The above chart taken from NPD shows May production dropping.
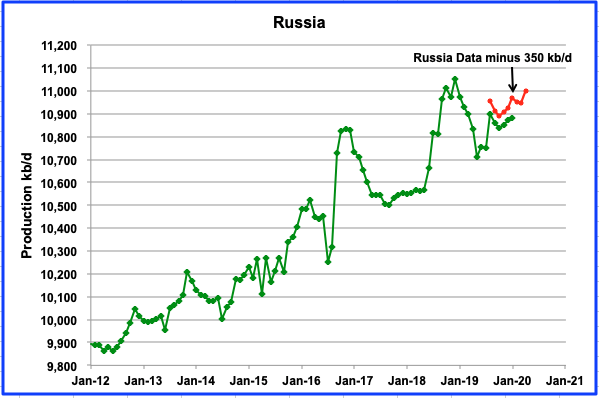
Russian production increased by 7 kb/d from December 2019 to January 2020 to 10,880 kb/d according to the EIA.
Shown in red is a modified version of the oil output as reported by the Russian Ministry of Energy. It is higher than the EIA numbers because it includes NGPLs. The Russian data has been reduced by 350 kb/d to show how closely it parallels the EIA data. It shows an increase of 51 kb/d from 11,298 kb/d in March 2020 to 11,349 in April 2020, an increase of 51 kb/d.
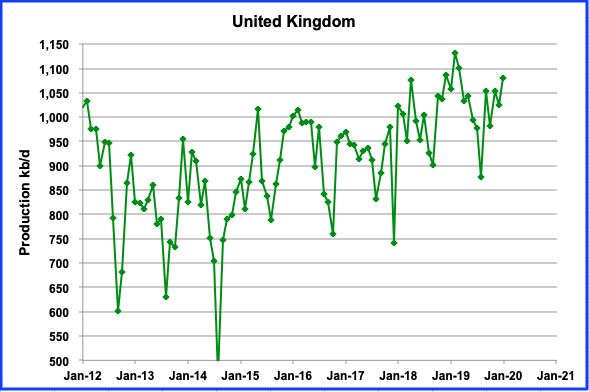
UK output has had an irregular production increase since the August 2019 low of 876 kb/d. January production reached 1,081 kb/d.
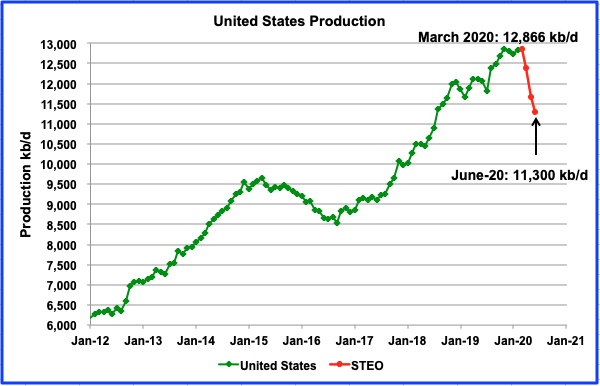
The May EIA STEO report shows US production peaked at 12,866 kb/d in March and then dropped dramatically in April. By June, output is expected to drop to 11,300 kb/d, an estimated decrease of more than 1,500 kb/d.
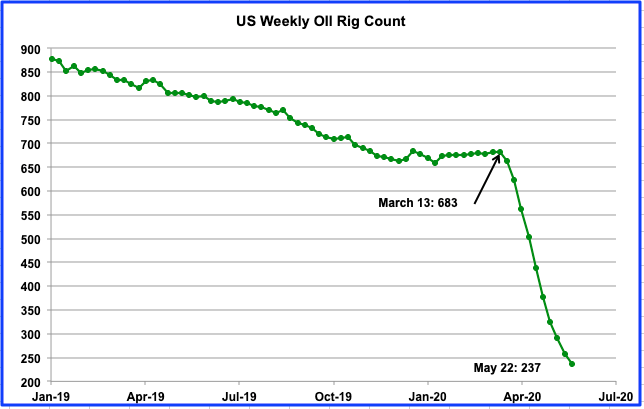
According to the Baker Hughes rig count, the US oil rig count for the week ending May 22 was 237. This was down from a high of 683 in the week of March 13. This is a drop of 446 rigs or 65%.
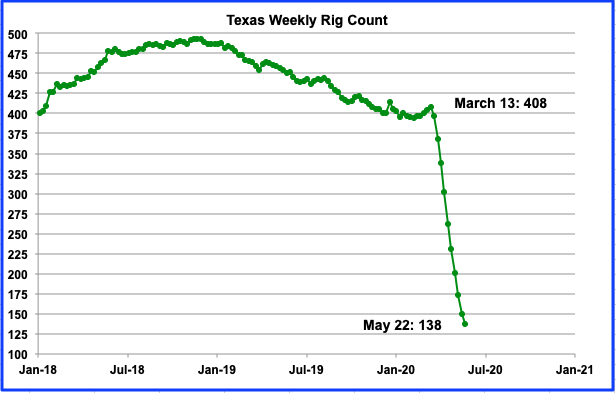
Above is the Baker Hughes Texas rig count for the week ending May 22. This looks like your classic Seneca Cliff. How will oil output follow? From March 13 to May 22, the number of rigs dropped by 270 to 138. For the week, rigs were down by 12 to 138.
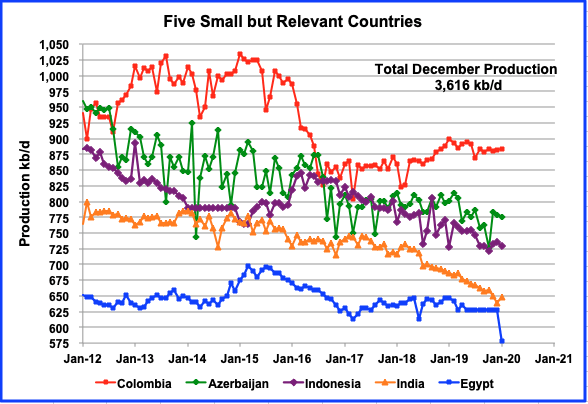
These five countries complete the list of Non-OPEC countries with annual production between 500 kb/d and 1,000 kb/d. All five are in overall decline. Their combined January production is 3,616 kb/d, down 34 kb/d from December’s output of 3,650 kb/d. Note that Colombiaʼs production has been essentially flat since August. Azerbaijan, Indonesia and India appear to be in a slow steady decline phase. Production peaked in March 2015 at 4,153 kb/d. Over five years, production has dropped by 537 kb/d or an annual average of 107 kb/d.
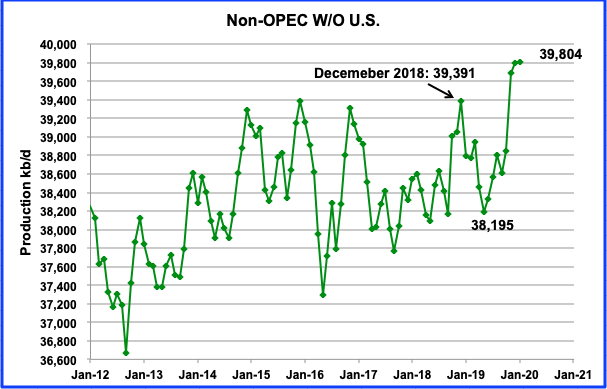
This chart is one of the more critical ones that bears watching. It is providing an early indication that Non-OPEC countries, excluding the US, are very close to an output plateau. From December 2015 to December 2018, peak output remained in the range of 39,300 kb/d to 39,400 kb/d. However, in December 2019 and January 2020, production reached a new high of 39,804 kb/d. Note that Ecuador has been transferred from OPEC to Non-OPEC and the charts have been updated to 2012.
The big jump in production to pass the previous high occurred in November 2019. The Non-OPEC countries, excluding the US, added 848 kb/d to push output above the previous high of 39,391 kb/d which occurred in December 2018. It is 413 kb/d higher than the previous high due to the arrival of new oil fields coming online. Primary contributors were Norway (202), Brazil (126), Canada (163) and Kazakhstan (65). January 2020 output added another 6 kb/d for a new high of 39,804 kb/d.
It is interesting to note that all of the previous peaks occurred in November and December. 2020 is the first year in which the peak occurred in January.
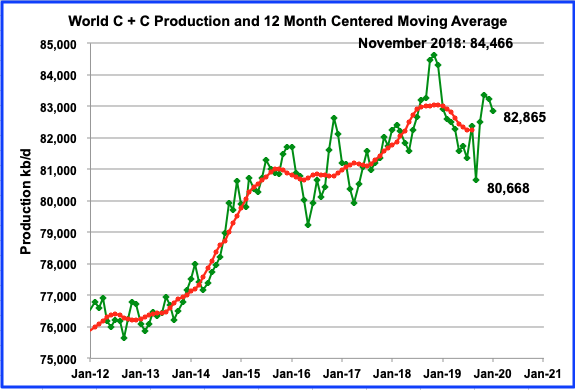
World oil production dropped in January by 370 kb/d to 82,865 kb/d from 83,235 kb/d in December. This puts January output 1,601 kb/d below the previous December 2018 high of 84,466 kb/d. With OPEC adding 1,798 kb/d in April, it would appear that the previous high might be challenged. However, production drops from other countries, especially the US, will offset much of the OPEC increase, and December 2018 will still retain its crown.
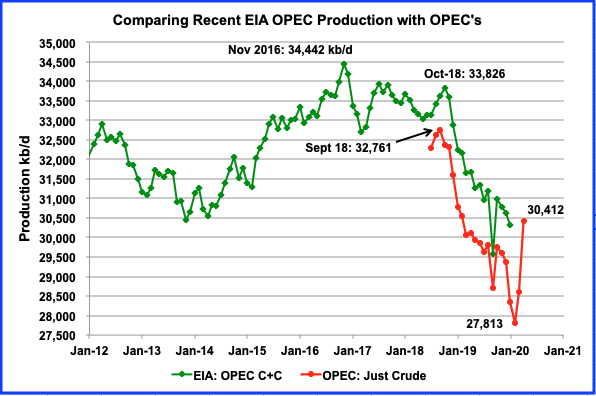
This is a comparison of the EIAʼs estimate of OPECʼs C + C production vs. OPECʼs crude output. The EIAʼs estimate is roughly 2,000 kb/d higher, due to the inclusion of condensate. According to the May OPEC report, April 2020 OPEC crude production was 30,412 kb/d and is now down by 2,349 kb/d from the peak in September 2018.
OPEC + Production Cut
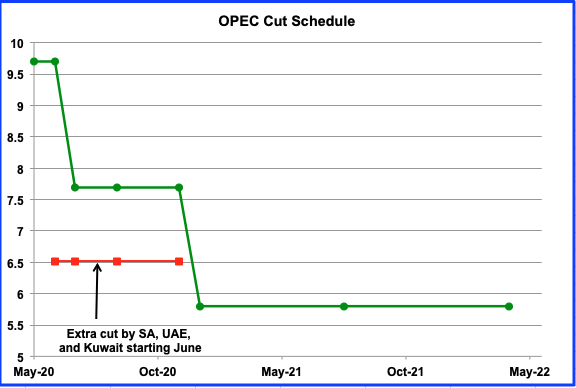
OPEC, in response to the reduced worldwide demand, arranged for a production reduction through a Declaration of Cooperation (DoC) with OPEC and Non-OPEC countries. The May 2020 OPEC report outlines the cut that they will implement over the next 20 months and is shown above.
“In response to this sudden and huge market imbalance, OPEC and the 10 non-OPEC participants in the Declaration of Cooperation (DoC), decided to adjust down their combined current production by 9.7 mb/d in May and June 2020, to be followed by a combined reduction of 7.7 mb/d in 2H20 and by 5.8 mb/d for a period of 16 months, from 1 January 2021 to 30 April 2022. Furthermore, on 12 May 2020, Saudi Arabia, the UAE and Kuwait announced that they would voluntarily deepen oil output adjustments from June, by 1 mb/d, 100 tb/d and 80 tb/d, respectively, in an effort to expedite draining a global supply glut and rebalancing the oil market.”
Editor’s Note: The summary bullets for this article were chosen by Seeking Alpha editors.
