
This post was originally published on this site

One typically finds some variation of this disclaimer at the bottom of financial marketing materials.
“Past performance is no guarantee of future results.”
It’s usually cast in small unappealing typeface underneath a gaudy chart depicting stellar past performance of an investment product. Reminds me of the rapid-fire litany of deadly side effects uttered at the tail end of a televised drug commercial.
The reality is everyone involved in the ad wants us to believe the past results. Why else would they be publishing them? Human nature inevitably assigns heightened weight to recent history. Investment managers that have performed well are the subject of flattering media coverage and receive accolades as top performers. This article will cite some recent studies of mutual fund results to offer some perspective on the notion that superior money managers can be identified.
The mutual fund universe evolves over time with many funds merging or liquidating as new ones open. Therein lies a key issue with evaluations of past performance. History is written by the winners. Any evaluation of a mutual fund complex’s current inventory of product options necessarily excludes the defunct (“loser”) funds. Indeed, fund complexes are quick to underscore the recent performance of their current offerings.
The number of funds that are routinely culled from a fund company’s inventory is substantial. 5% of domestic equity mutual funds were shuttered in 2019 alone. Mergers between two large fund complexes provide an opportunity for the enlarged new firm to clean house. Last year, the combination of Invesco and Oppenheimer caused 27 mutual funds to be merged into another entity.
Additionally, failed investment strategies are often recast under a different investment style. Thus, the fund doesn’t “die”, but rather, mutates into another investment strategy. That new strategy is typically popular with investors because of recent favorable market action.
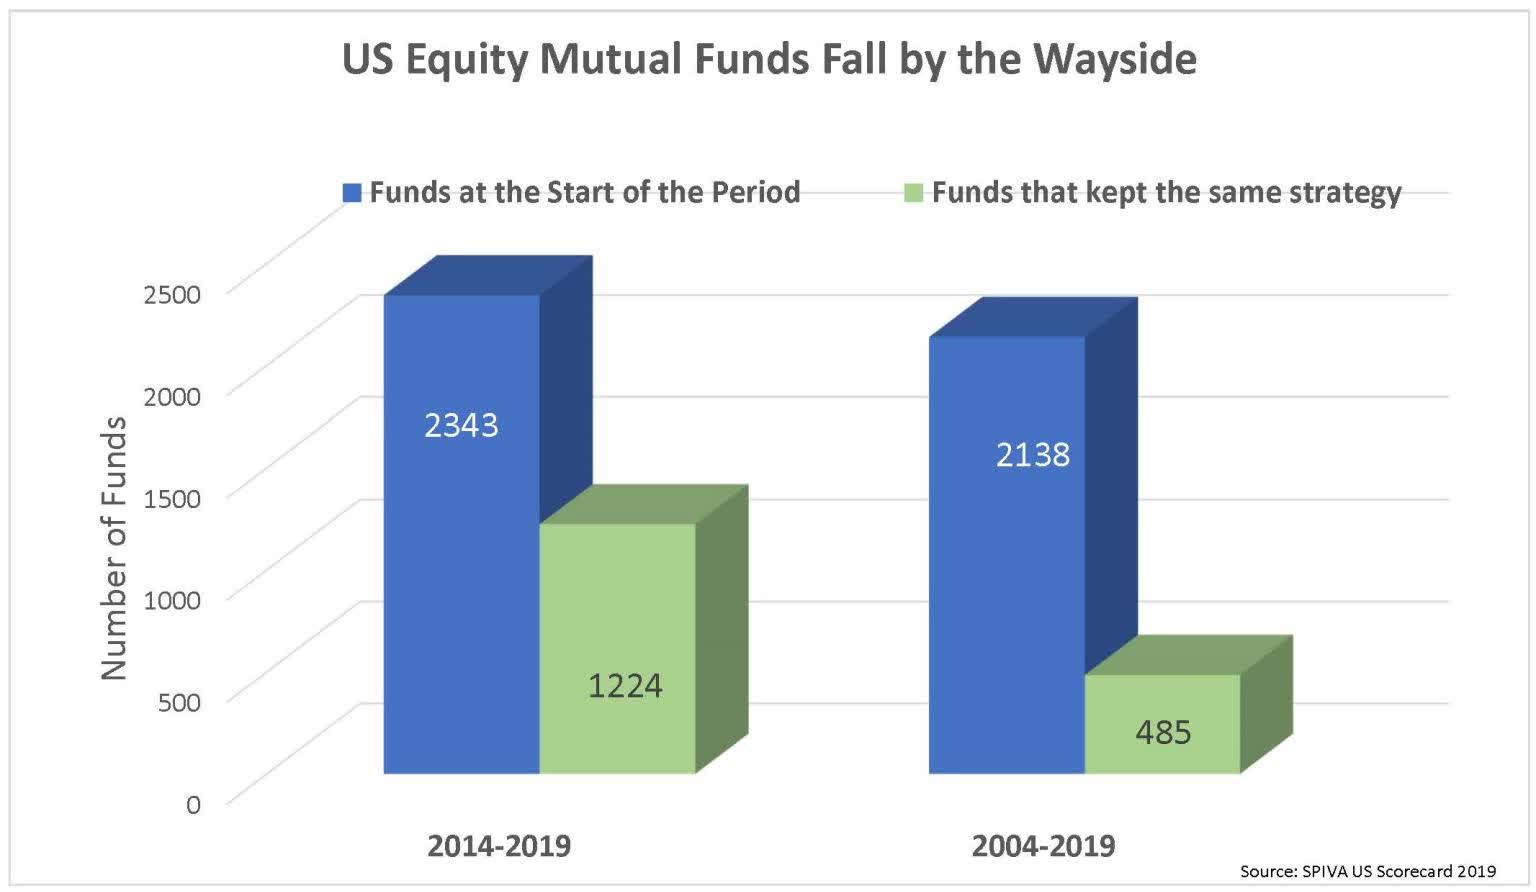
S&P Dow Jones Indices recently evaluated the churn among active US equity funds. It tracks the funds which existed at the beginning of a period and counts the survivors. The results are surprising. Almost half the funds either merge, liquidate, or change strategy within 5 years. Within 15 years, less than one-quarter of active funds are still open for business under the same mandate!
It should be no surprise that the likelihood of fund closure correlates highly with recent returns. Money chases performance and funds that do poorly hemorrhage assets. Domestic equity funds that were bottom-quartile performers for the 3 years ending in December 2016 were four times as likely to be merged or liquidated within the next 3 years as top-quartile performers.
S&P Dow Jones Indices retains comprehensive mutual fund data going back almost twenty years, including merged and liquidated funds. Thus, the results cited here account for the true opportunity set of funds available to any investor at the beginning of an investment horizon. The dead funds are added back in.
With the inclusion of all mutual fund return data, we can better evaluate the success of actively managed mutual funds against their benchmarks. It is well-settled that a majority of mutual funds underperform their passive benchmarks. However, an investor can access many databases to pick “above-average” recent performers. Does that historical insight meaningfully forecast future results?
The S&P Dow Jones Index data does show some weak persistence in performance. The following chart describes the subsequent performance of the 567 top-quartile active US equity funds as of September 2015 at the end of each of the next 4 years. The fraction remaining in the top quartile (blue bar) is compared to the fraction that is to be expected via random chance (orange bar).
You’ll note that the orange bar, denoting random chance, dissipates over time to reflect the diminishing likelihood of consecutive favorable occurrences. As an example, the likelihood of a fund achieving top-quartile performance via luck for two consecutive periods would be 0.25 x 0.25 = 6.25%.
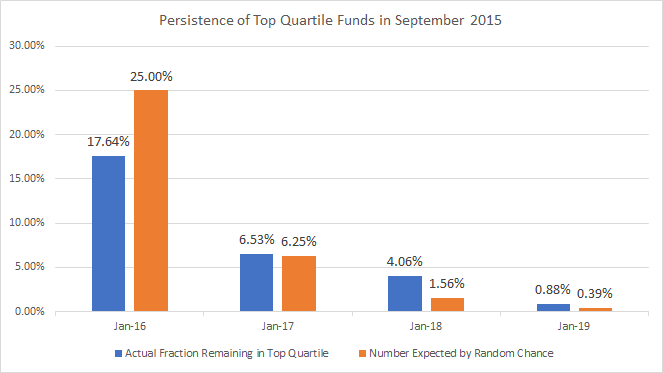
The chart does reveal some evidence of weak persistence. That is, the number of funds that continue to outperform 2, 3, and 4 years later is a bit higher than forecast by random chance. And we’re being generous here as we ignore the requirement that the data demonstrate statistical significance.
Even if we grant that funds with good recent track records do marginally better than their peers, it doesn’t suggest that investors go out and start chasing performance. They have a simple alternative: buy the index. It’s not enough to beat your peer group when an indexed alternative routinely outperforms that same peer group.
So, how do funds with good track records stack up against their passive benchmark? Not very well.
Let’s start with the very recent past. There were 99 US large cap equity funds that beat the S&P 500 in the three years ending September 30th, 2016. Of those, none continued to outperform in each of the next 3 years.
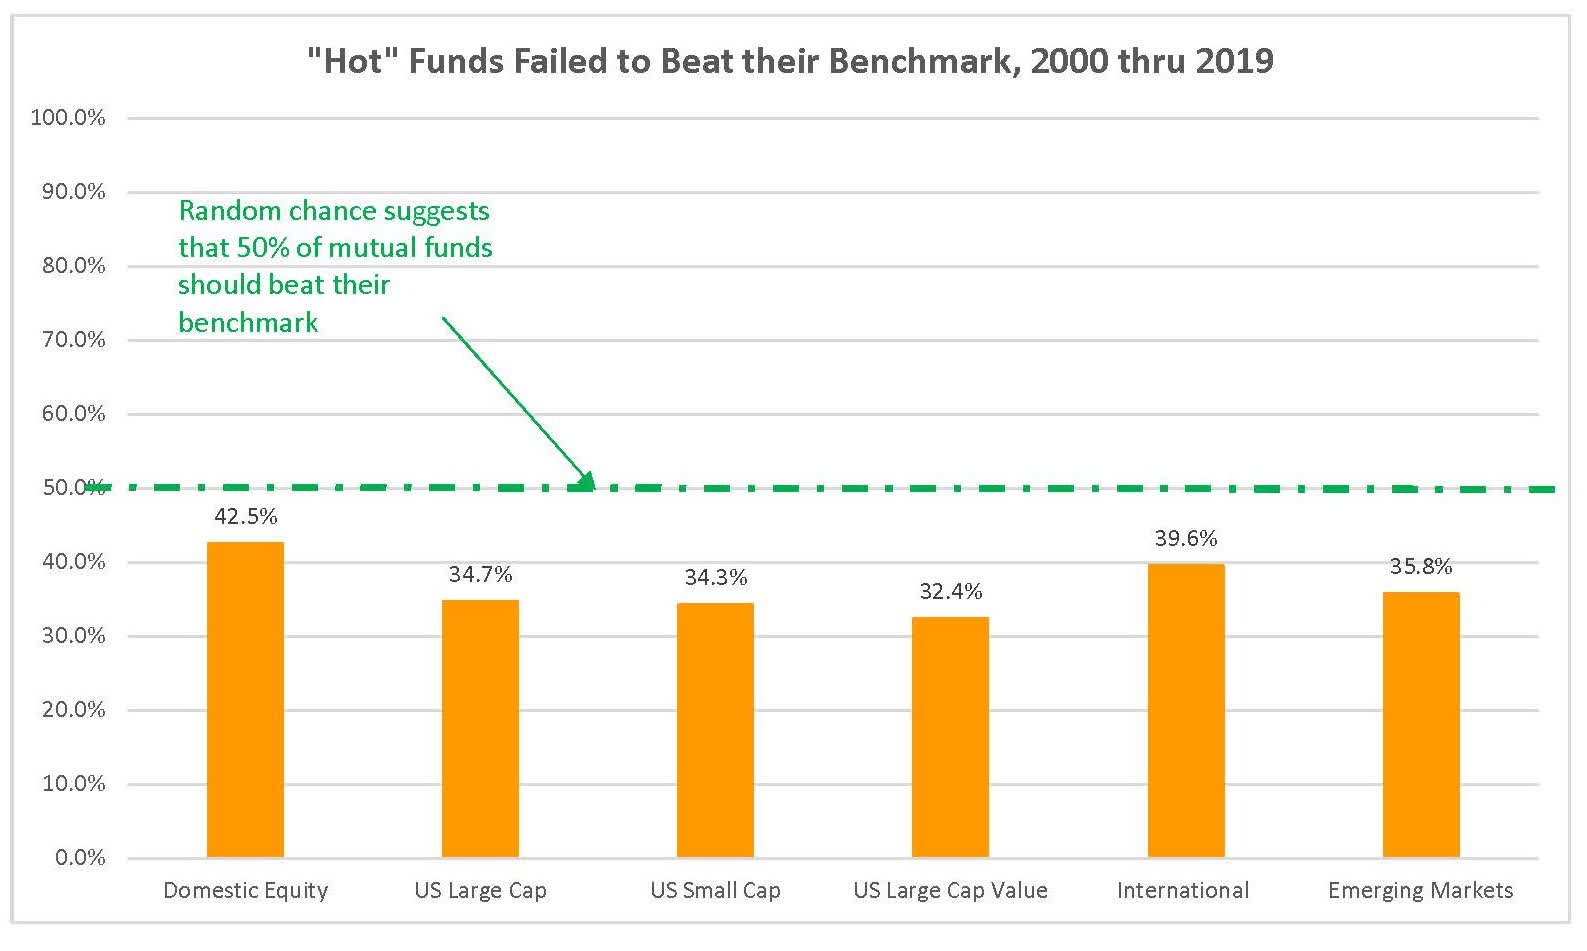
Consider a more comprehensive review of the data going all the way back to calendar 2000. S&P culled out those equity funds that outperformed their benchmark for rolling 3-year periods starting at the turn of the century. We’ll call them “hot” funds. It then compared the subsequent 1-year performance of the hot funds with those of their benchmark in over 20 different categories of stocks. In every case, less than 50% of the “hot” funds beat that benchmark in the subsequent year. The chart below outlines a few of those key asset classes.
Of course, we can’t look at all the possible measurements of manager skill in this short article. However, the data here represent some insight that is both current and reasonable. Once we correct for survivorship bias in mutual fund performance data, the active manager universe looks more and more like random noise. Stock-picking skill remains stubbornly difficult to identify. Index funds routinely deliver better long-term results.
Disclosure: I am/we are long SPY. I wrote this article myself, and it expresses my own opinions. I am not receiving compensation for it (other than from Seeking Alpha). I have no business relationship with any company whose stock is mentioned in this article.
