
This post was originally published on this site
Introduction
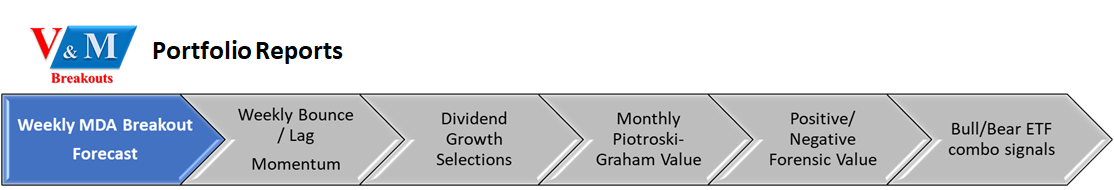
The Weekly Breakout Forecast continues my doctoral research analysis on MDA breakout selections over more than five years. This subset of the different portfolios I regularly analyze has now reached 158 weeks of public selections as part of this ongoing live forward-testing research.
In 2017, the sample size began with 12 stocks, then 8 stocks in 2018, and at members’ request into 2020, I now generate four selections each week, two Dow 30 picks, and a separate article for monthly Growth & Dividend MDA breakout stocks. I now provide six different ways to beat the S&P 500 since my trading studies were made public.
Remarkably, the frequency streak of 10% gainers within a four- or five-day trading week remains at highly statistically significant levels above 80%, not counting frequent multiple 10% gainers in a single week. More than 200 stocks have gained over 10% in a five-day trading week since this MDA testing began in 2017.
How the Momentum Gauge trading model works
I am revealing additional insights into the gauges to help readers better understand how I use this model to consistently beat the S&P 500 and protect investments. Members of my service receive much more information and background on this system including my doctoral research and presentation materials. The links in the introduction section above will also help you greatly.
The Momentum Gauges™ work as a broad measure of all the stocks on the major US exchanges that are either in the outlier conditions of high positive breakout or high negative breakdown conditions. By comparing these two segments from my research, I can model where the strongest market directional forces are acting as a leading indicator. This can also be applied at the sector level when the market is not acting in a broad rally and some sectors are still in strong breakout conditions.
The Momentum Gauges™ turned positive again on April 23rd, for the first positive signal in two months. Since the change in signal the S&P 500 has gained +2.30%. The broad market entered conditions nearly consistent with Positive Acceleration condition Segment 6, although some sectors remain in weaker momentum conditions. The best approach is a sector analysis using the Momentum Gauges™ provided during the week to members.
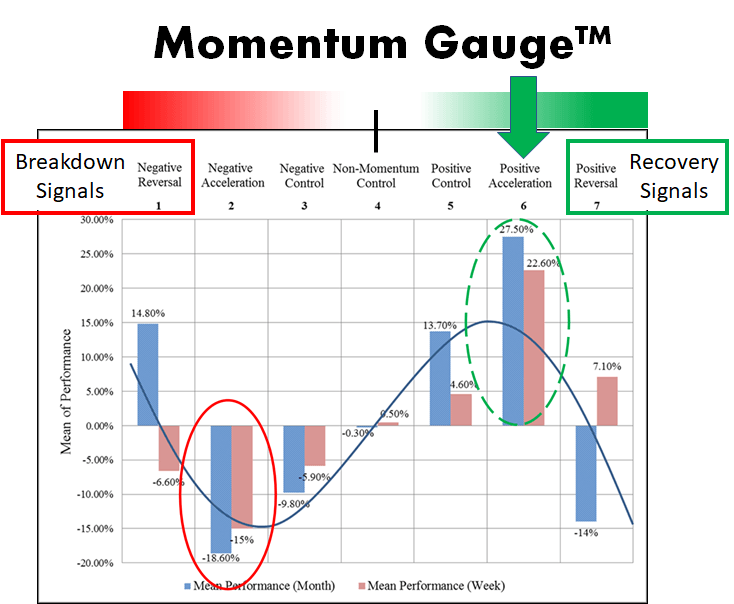
The Seven Segments of the Momentum Cycle
Each of these segments is identified by comparing the positive and negative scores from my research model that is run many times a day. Those scores are shown on the Momentum Gauge charts later in the article.
- Segment 1 – Negative Reversal includes the Breakdown Signal that occurred on Feb. 24th that shows a sudden early change in market direction. This is detailed most recently here: Revisiting The Signals That Forecasted Every Recent Decline, In Search Of Early Recovery Indicators
- Segment 2 – Negative Acceleration is our current overall market condition from the negative signal on Feb. 24th. With another -2.08% loss in the S&P 500 again this week, the overall market remains in strong negative condition with over -25% declines since late February.
- Segment 3 – Negative Control is a phase with negative market conditions with declines that are small and steady involving much less accelerating decline.
- Segment 4 – Non-Momentum phase is when the overall market may be in the process of changing direction or is stalled out with very little cause to either rise or fall. In this condition, the positive and negative Momentum Gauge scores would be nearly even and/or both relatively low.
- Segment 5 – Positive Control is the condition of a positive market with small and steady gains that do not involve many large positive accelerating gains.
- Segment 6 – Positive Acceleration is the strong positive bull market condition where gains are large and accelerating at a record pace with high net inflows into the market. In these conditions, nearly any stock will deliver positive returns as a strong market exuberance or FOMO buying behavior becomes common.
- Segment 7 – Positive Reversal involves a key breakout reading on the Momentum Gauges that confirms a positive change in market direction on the daily and/or weekly charts. This is what members of my trading community are focused on finding next for the earliest signal of a strong and safe entry point in the market.
2020 YTD Breakout Portfolio Returns
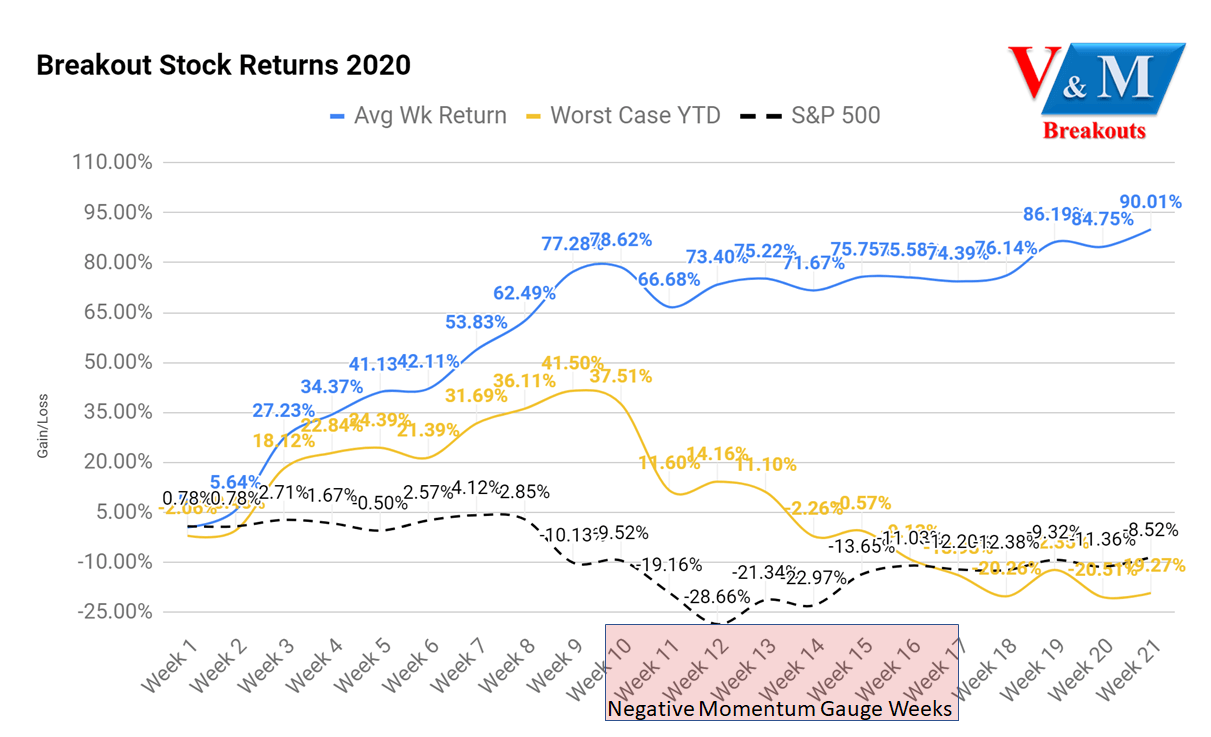
The Breakout Picks are high volatility selections for short-term gains, but with no selections below $2/share, under 100k avg daily volume, or less than $100 million market cap. The returns were at +41.50% in the first nine weeks of 2020, consistent with exiting the portfolio following the negative Momentum Gauge™ signal of Feb. 24th (red weeks below). In the worst case, fixed buy/hold, do nothing, equal weighted returns through Week 21 the returns are -19.3% compared to the S&P 500 -8.5% over the same period.
The cumulative average returns YTD are +90.01% with the very best-case timed returns at +199.3%. 29 stock selections in the past 21 weeks have gained over 10% in less than five days with 10 of those stocks gaining over 19% and as high as +77%. I have removed the best-case returns from the chart below as it begins to distort the chart between the very worst possible returns and the actual S&P 500 returns shown below.
(Source: Value & Momentum Breakouts)
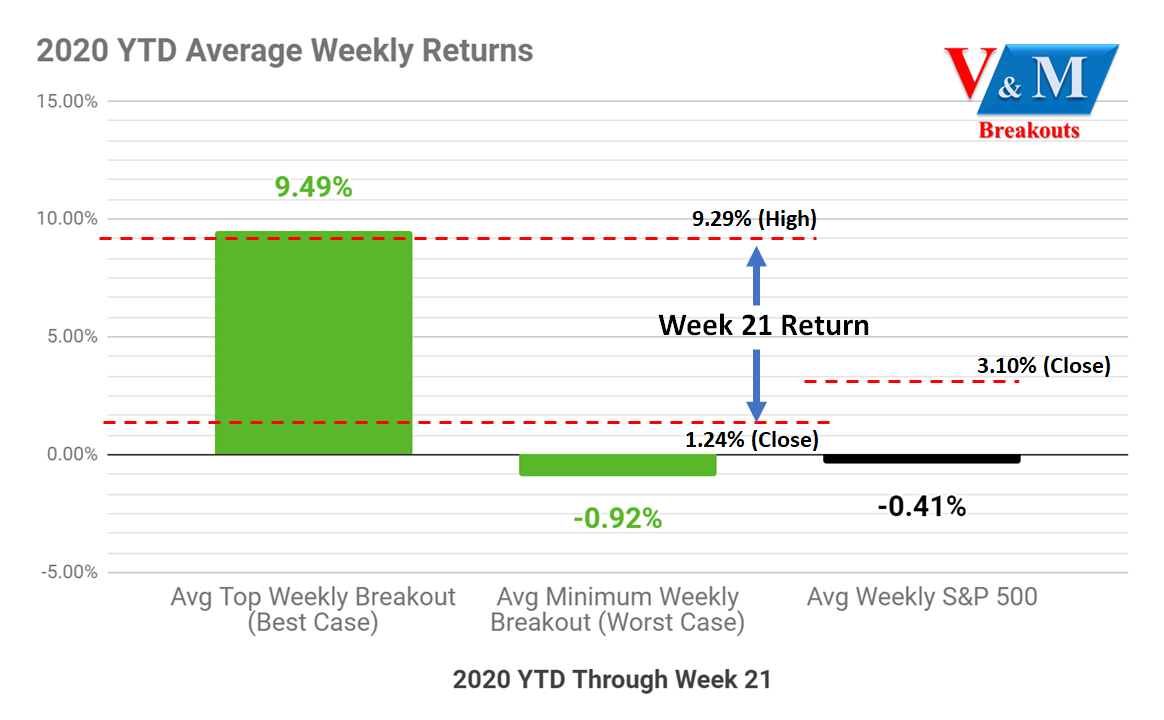
The best-case average weekly returns are +9.49% and worst-case average -0.92% YTD as shown below. These returns include trading against all the Negative Momentum Gauge signal warnings, which increases your risk of declines, but are conducted without interruption for testing and measurement purposes.
(Source: Value & Momentum Breakouts)
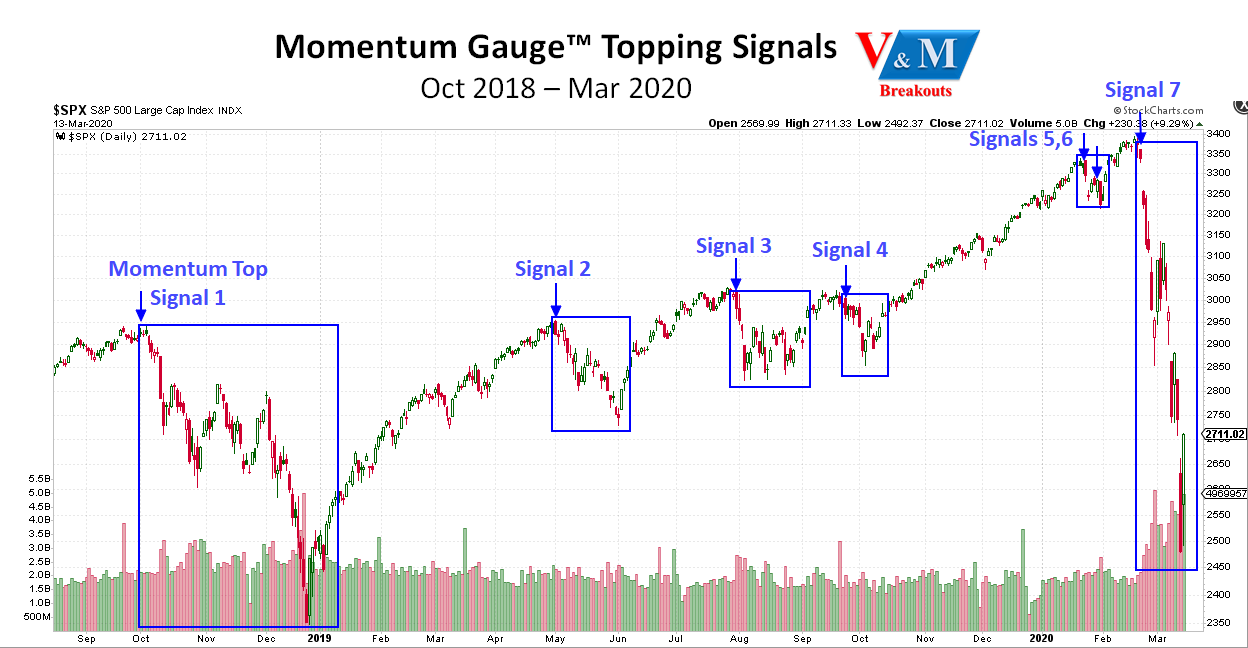
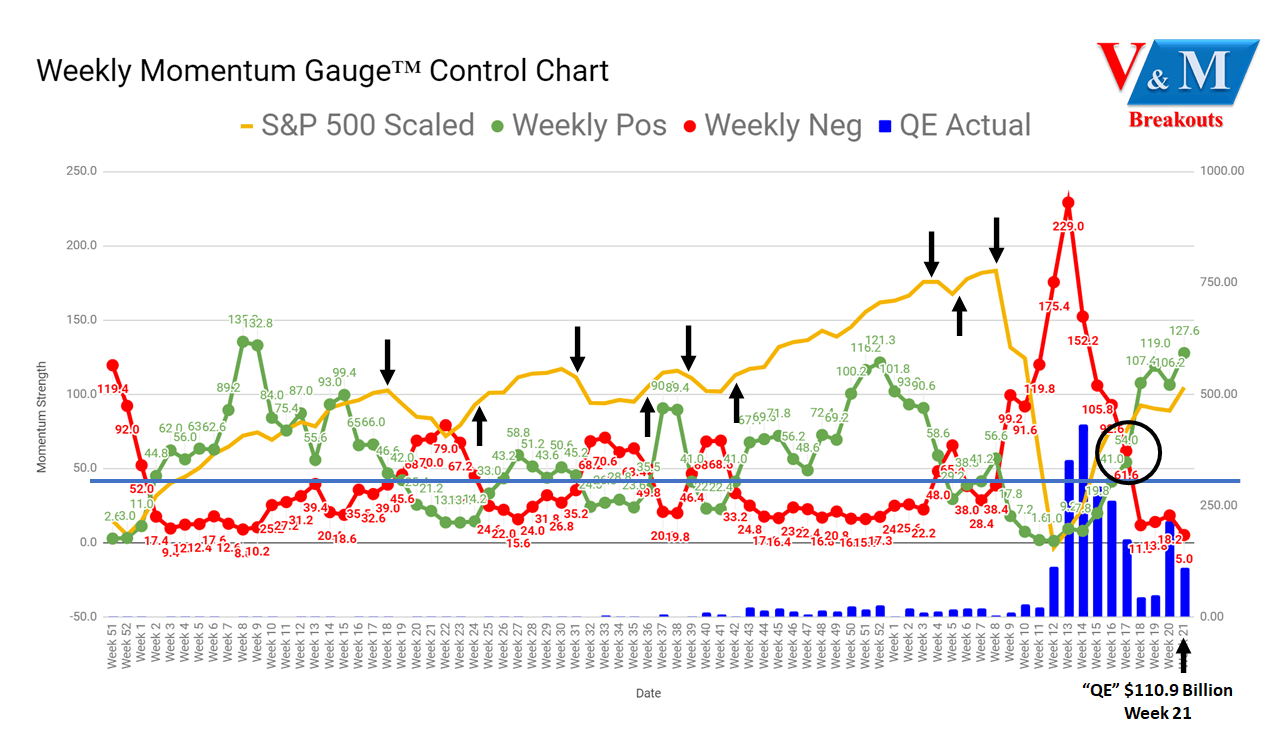
You can see how each of the seven prior events numbered above relate to the Momentum Gauge topping signals shown below. These forecasted market tops are detailed in my recent article as we look for a new positive reversal signal: Revisiting The Signals That Forecasted Every Recent Decline, In Search Of Early Recovery Indicators
Over the years, the evidence is clear that timing your investments during the most positive momentum periods greatly enhances your weekly returns. We have recently experienced a new Positive Momentum Gauge™ signal on April 23rd that may mark a longer-term recovery point.
(Value & Momentum Breakouts)
Market Conditions into Week 22
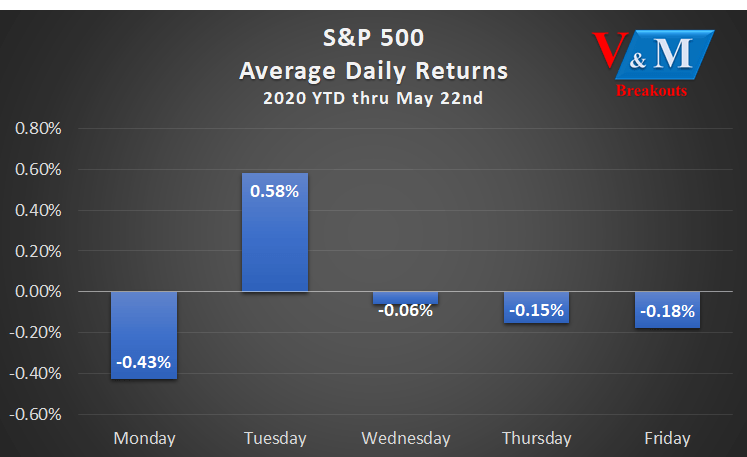
Tuesday continues with historical patterns well documented in published research as the best day of the week, especially in weeks with FOMC meetings and the current POMO schedule. Every day of the week except Tuesday continues with negative average returns YTD. Research studies discussed in the Members’ Library show that this is a pricing behavior patterned on the Fed’s strong intervention activity. Last year, Fridays were by far the best day of the week.
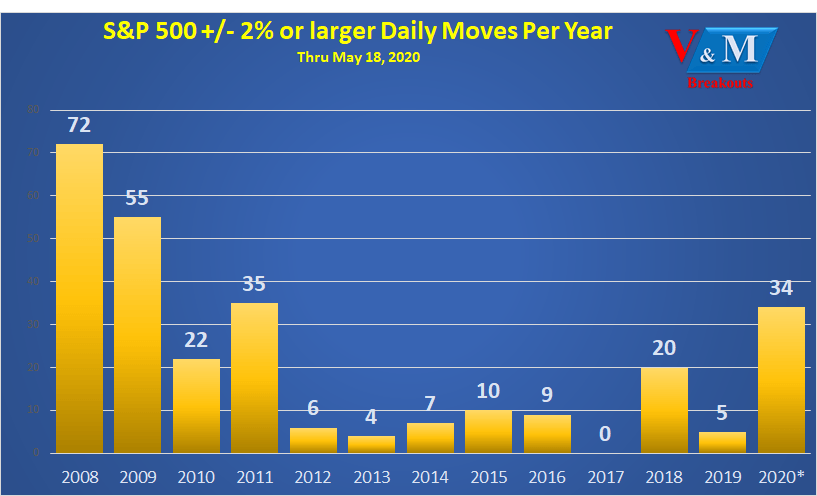
Extreme volatility continues into 2020 now with 34 daily moves greater than +/- 2% on the S&P 500 in just the past three months. These are more daily +/- 2% moves than the years 2012, 2013, 2014, 2016, 2017, and 2019 COMBINED. It is highly unlikely that this extreme volatility is over as we head into Q2 with some of the worst economic GDP forecasts since at least 1943.
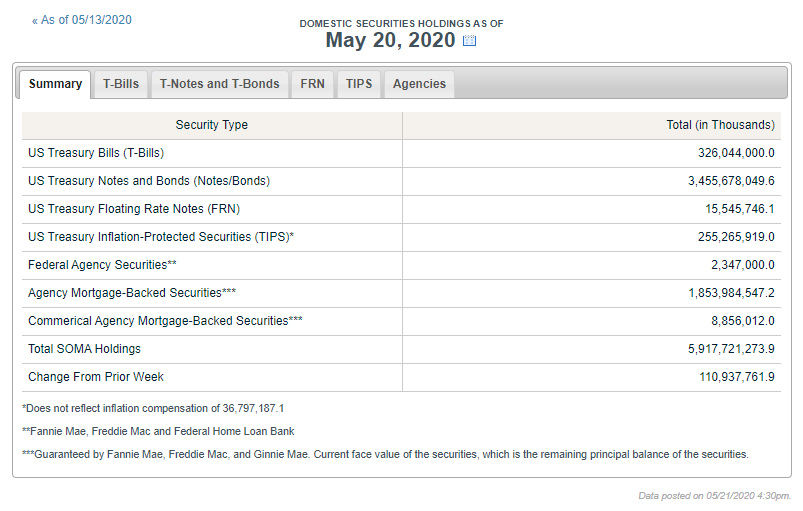
We can confirm the Fed added $110.9 billion in assets to its balance sheet this week in continued high stimulus activity, but down from $215.2 billion last week. Combined, this brings the total easing to around $2.33 trillion in liquidity just the past 27 weeks. This has also pushed the Federal Reserve’s balance sheet to the highest level in US history to over $7 trillion.
System Open Market Account Holdings – FEDERAL RESERVE BANK of NEW YORK
The Daily Momentum Gauge™ scores closed Friday at Negative 6 and Positive 130 and the more detailed daily chart is reserved for members. The Weekly Momentum Gauge™ chart below shows continued positive conditions from the Apr 27 crossover signal as well as some strong relationship with Fed stimulus activity. The Weekly Momentum Gauge™ chart below also shows the Fed’s massive easing activity in dark blue. This week saw $110.9 billion in more easing but down from 215.2 billion last week.
(Value & Momentum Breakouts)
Two conditional signals that are very important to watch:
- Avoid/Minimize trading when the Negative score is higher than the Positive momentum score.
- Avoid/Minimize trading when the Negative score is above 70 on the gauge.
The MDA momentum gauges have correctly called every major market direction change since they began. The more detailed daily Momentum Gauges are reserved for members of my subscription service. These movements and signals were updated in more detail through the Daily Update articles this past week:
- V&M Breakout Morning Update – May 22: S&P 500 Near 2930 Rebounding From 2900 Lows Overnight After Jobless Claims Met Expectations Thursday
- V&M Breakout Morning Update – May 21: S&P 500 Testing 2950 Support On Jobless Claims Thursday With Oil Sector Moving Above $34/Bbl
- V&M Breakout Morning Update – May 20: S&P 500 Back Above 2940 Support And Dow 30 Up Over 250 Points Premarket And Oil Sector Moving Above $32/Bbl
- V&M Breakout Morning Update – May 19: S&P 500 Above 2940 Support After 34th Daily Move Greater Than +/- 2% In The Past 3 Months With VIX Volatility Below 30 Premarket.
- V&M Breakout Morning Update – May 18: Markets Sharply Higher, Dow Up Over 400 Points Premarket With Crude Oil Above $32/Bbl And Momentum Gauges™ Closed Friday At Positive 80 And Negative 12.
The Week 22 – 2020 Breakout Stocks for next week are:
The selections consist of three Healthcare and one Technology sector stock. Sample selections for this week are:
Aptinyx – Healthcare/Biotechnology
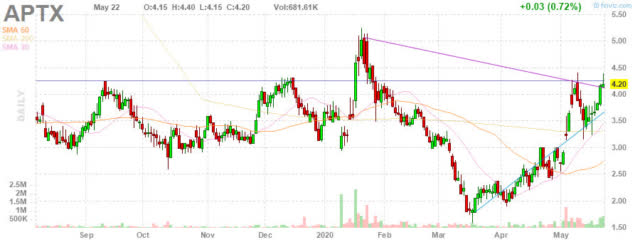
Price Target: $5.00
(Source: FinViz)
Aptinyx Inc., a clinical-stage biopharmaceutical company, focuses on the discovery, development, and commercialization of novel, proprietary, and synthetic small molecules for the treatment of brain and nervous system disorders. The company is developing NYX-2925, which is in Phase II clinical development for the treatment of painful diabetic peripheral neuropathy, as well as in Phase II clinical trial for treating fibromyalgia.
(Source: StockRover) 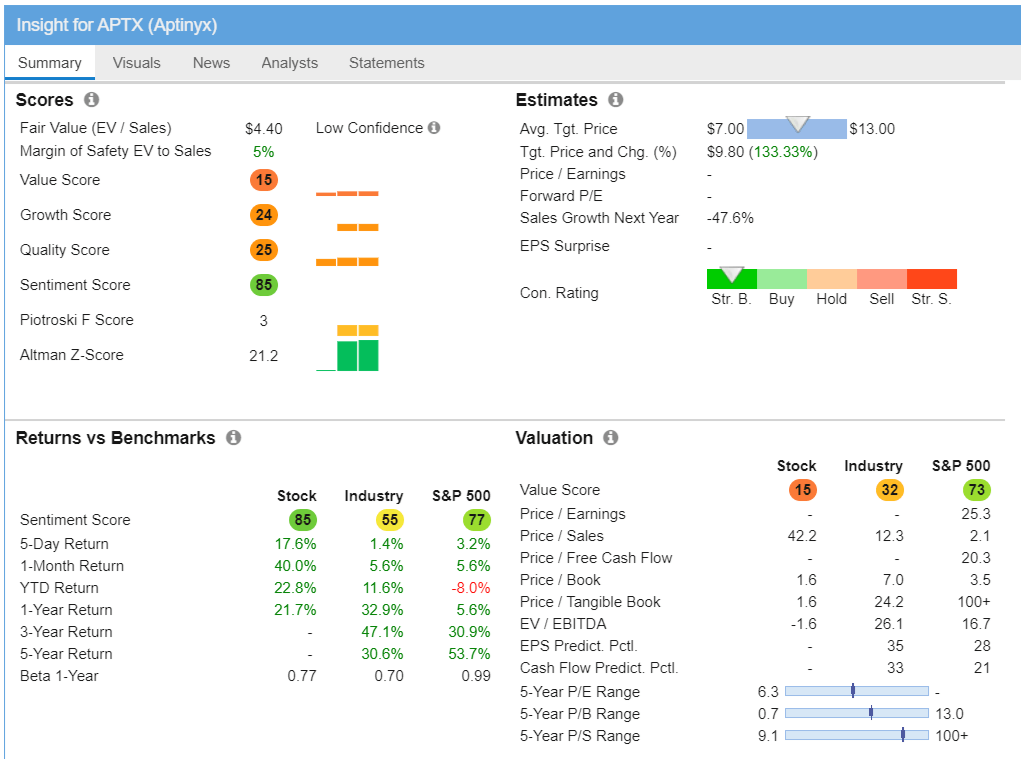
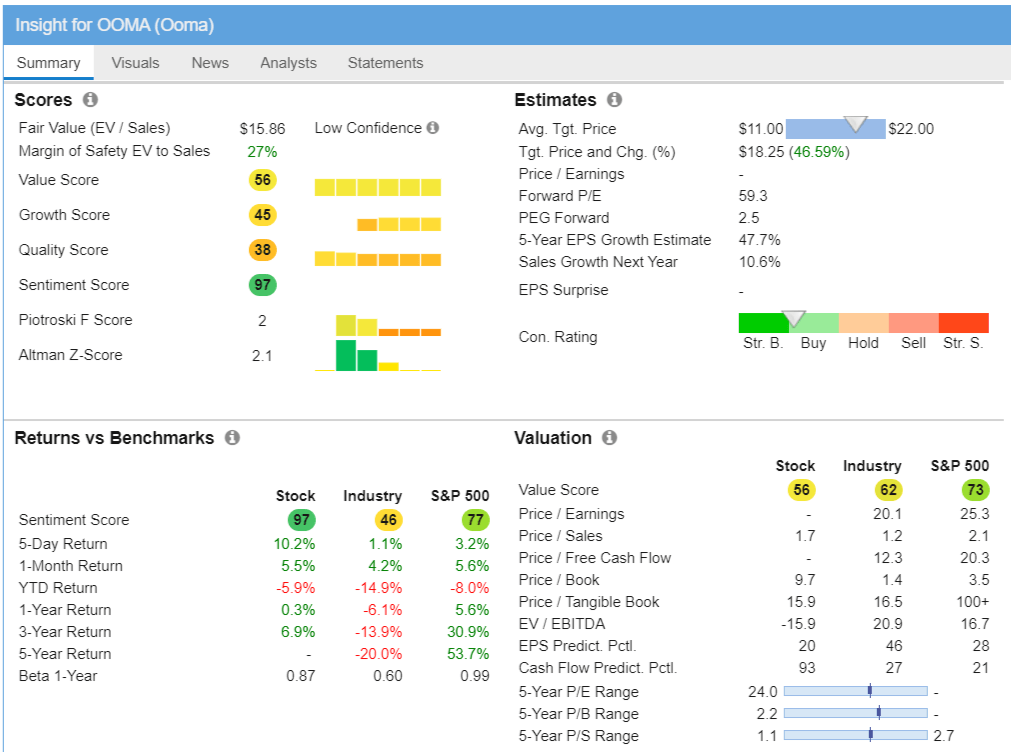
Ooma, Inc. – Communication Services/Telecom
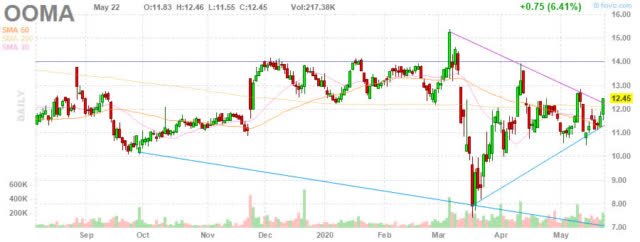
Price Target: $15.00
(Source: FinViz)
Ooma, Inc. creates connected experiences for businesses and consumers in the United States, Canada, and internationally. The company’s smart cloud-based software-as-a-service and unified-communications-as-a-service (UCaaS) platforms serve as a communications hub, which offers cloud-based communications solutions, smart security, and other connected services. Its business and residential solutions deliver PureVoice high-definition voice quality, advanced functionality, and integration with mobile devices; and platform helps to create smart workplace and homes by offering communications, monitoring, security, automation, productivity, and networking infrastructure applications.
(Source: StockRover)
Top Dow 30 Stocks to Watch for Week 22
Applying the same MDA breakout model parameters without regard to market cap or the below-average volatility of mega-cap stocks may produce strong breakout results relative to other Dow 30 stocks.
While I don’t expect Dow stocks to outperform typical breakout stocks over the measured five-day breakout period, it may provide some strong additional basis for investors to judge future momentum performance for mega-cap stocks in the short- to medium-term. The most recent picks of weekly Dow selections:
| Symbol | Company | Current % return from selection |
| (UNH) | UnitedHealth Group | -0.35% |
| (MRK) | Merck | -4.27% |
| (NKE) | Nike | +4.27% |
| (AXP) | American Express | +1.62% |
| (MSFT) | Microsoft | +5.12% |
| (V) | Visa | +8.71% |
| (CVX) | Chevron Corp. | +3.76% |
| (XOM) | Exxon Mobil | +1.99% |
| (HD) | Home Depot | +15.50% |
| (AXP) | American Express | +2.22% |
The Dow pick for next week are:
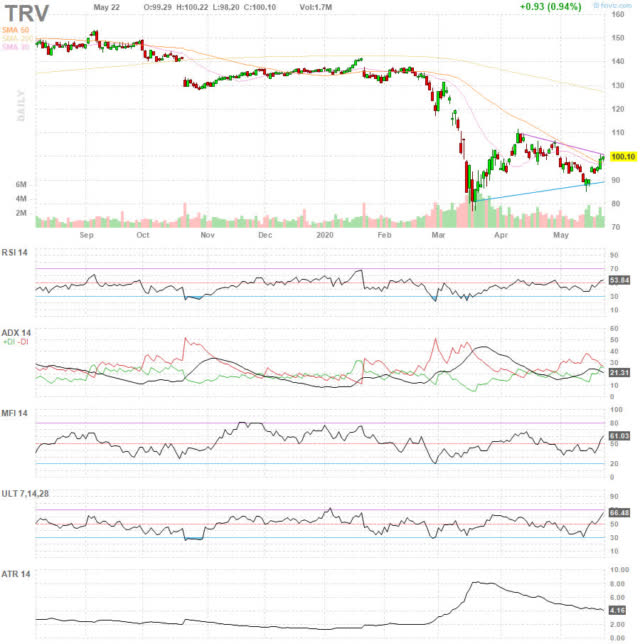
The Travelers Companies, Inc. (TRV)
Travelers reported mixed Q1 results on Apr 21st and the price has fallen through mid-May. Current technical and sentiment indicators show very high net MFI inflows and all the short-term measures turning positive this week for high potential breakout to April highs around 110/share.
Background on Momentum Breakout Stocks
As I have documented before from my research over the years, these MDA breakout picks were designed as high frequency gainers.
The point to be made is that the Momentum Breakout model was designed to increase the frequency, i.e. the rate over time, for selecting stocks that make greater than 10% moves. I know that when using the arbitrary period of 1 week (4 or 5 trading days) this model is consistently outperforming the market at more than 4 times the expected market frequency. So what if I take a look at longer momentum survivors? Can we see decay in performance among the top stock selections? ~ Value & Momentum Breakouts 2017
The frequency percentages remain very similar to returns documented here on Seeking Alpha since 2017 and at rates that greatly exceed the gains of market returns by 2x and as much as 5x in the case of 5% gains.
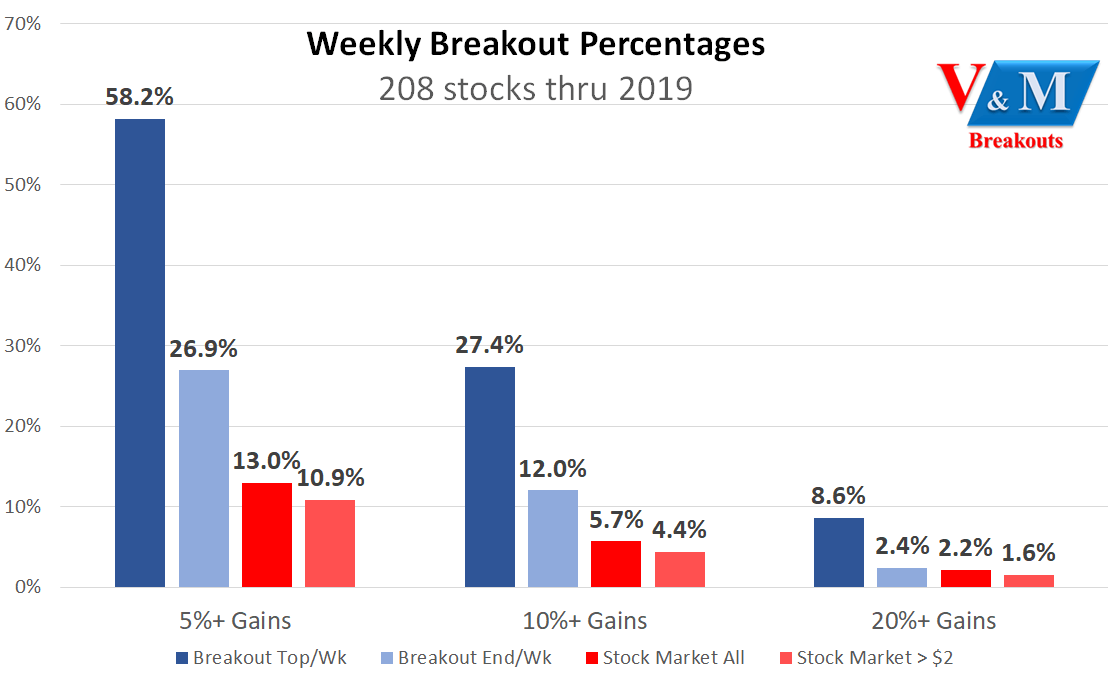
(Value & Momentum Breakouts)
These percentages reflect the results from 208 MDA breakout selections through 2019 across 52 weeks with 4 stocks selected each week. MDA selections are restricted to stocks above $2/share, $100M market cap, and greater than 100k avg daily volume. An additional Stock Market column was added to compare similar groups that exclude high volatility penny stocks below $2/share.
Conclusion
These stocks continue the live forward-testing of the breakout selection algorithms from my doctoral research with continuous enhancements over prior years. These Weekly Breakout picks consist of the shortest duration picks of seven quantitative models I publish from top financial research that include one-year buy/hold value stocks.
My general Market Outlook was published as part of the SA Roundtable Edition and my views for 2020 have not changed as the market recovers primarily on record levels of stimulus.
The May MDA breakout Growth & Dividend stocks have now been released. The April portfolio and other prior monthly long-term selections continue higher as the market improves.
The V&M Premium Portfolio gained +3.1% this week and is up +2.86 YTD and more than 11% ahead of the S&P 500 YTD.
All the very best to you, stay safe and healthy and have a great week of trading!
JD Henning, PhD, MBA, CFE, CAMS
 If you are looking for a great community to apply proven financial models with picks ranging from short term breakouts to long term value and forensic selections, please consider joining our 700+ outstanding members at Value & Momentum Breakouts
Disclosure: I am/we are long LABU, SOXL, NAIL. I wrote this article myself, and it expresses my own opinions. I am not receiving compensation for it (other than from Seeking Alpha). I have no business relationship with any company whose stock is mentioned in this article.
