
This post was originally published on this site
Some investors are drawing parallels between the stock market’s 2021 climb and the pattern seen in 1987, a year that saw a seemingly relentless rally completely undone by the “Black Monday” crash in October, but there are some important differences, analysts note.
Granted, the comparison does feel appropriate, at least on the surface, said Nicholas Colas, co-founder of DataTrek Research, in a Wednesday note.
“Everyone, from plugged-in hedge-fund managers to retail investors, is making money. The movie ‘Wall Street’ debuted in late 1987 and, while this decade’s Bud Fox may be working from home, the overall societal vibe is similar.”
But the comparison doesn’t look so apt when comparing the year-to-date performances of the S&P 500 index
SPX,
he said. The large-cap benchmark was up 36% through Aug. 17, 1987, versus just 18% for the same period in 2021.
Archive: 30 years after Black Monday, could stock market crash again?
As for the two years prior, 1985 and 1986 saw S&P 500 total returns of 31% and 18%, respectively, matching up identically with returns in 2019 and 2020 which Colas acknowledged is a bit “spooky.” However, he maintained, the 2021 rally is still a “pale comparison” to what was going on in 1987.
Stocks were mostly lower on Wednesday, a day after the S&P 500 and the Dow Jones Industrial Average
DJIA,
each snapped a five-session streak of record finishes.
Meanwhile, analysts at Bespoke Investment Group this week pointed out that the S&P 500 is on pace to set a record for, well, records. Tuesday’s all-time closing high was not only the fifth in a row, it was also the 49th of 2021. That puts the index on track for 78 closing highs this year, which would edge out the record 77 seen in 1995.
It’s no sure thing, the Bespoke analysts cautioned, noting that even a 5% pullback could eat into the ability to maintain a record-breaking pace. They noted that since 1950, there have been five years where the S&P 500 had more than 40 record highs through Aug. 16, and while both 1995 and 1964 were the leaders in those years, years like 1987, 1997, and 1998 also had more than 40 record highs at this point in the year, and none of them finished the year with more than 50.
Need to know: Labor Day has been a turning point in markets the last three years. Here’s what one strategist sees happening next.
But more important, what does such a rapid pace of closing highs mean for full-year performance? It’s mostly positive, as one would suspect, though there are exceptions, including, of course, 1987 (see table below).
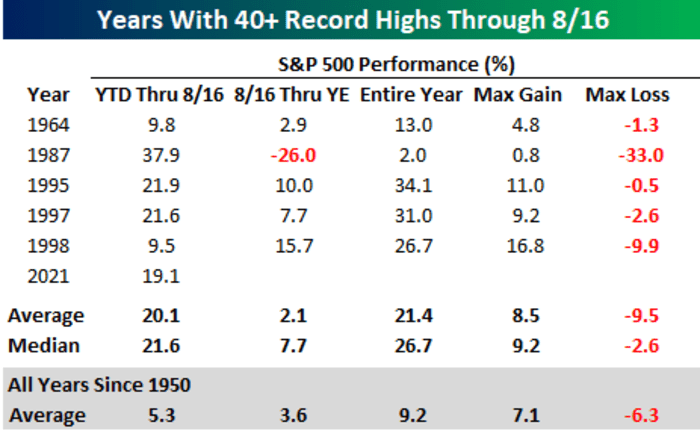
Bespoke Investment Group
The S&P 500’s year-to-date gain is very similar to the median and average return of the five prior years in the table, the analysts noted.
“Looking ahead, the median rest of year performance for the index from the close on 8/16 through year-end was a gain of 7.7% with positive returns four out of five times and more than doubling the average rest of year performance for all years since 1950,” they wrote, noting that “the one exception was in 1987 and it was a doozy.”
So what should investors make of it all?
The Bespoke analysts noted that the usual caveats apply — there’s no guarantee and past performance isn’t indicative of future results — but the data does underline the observation that “strength often begets strength in the market.”


