
This post was originally published on this site
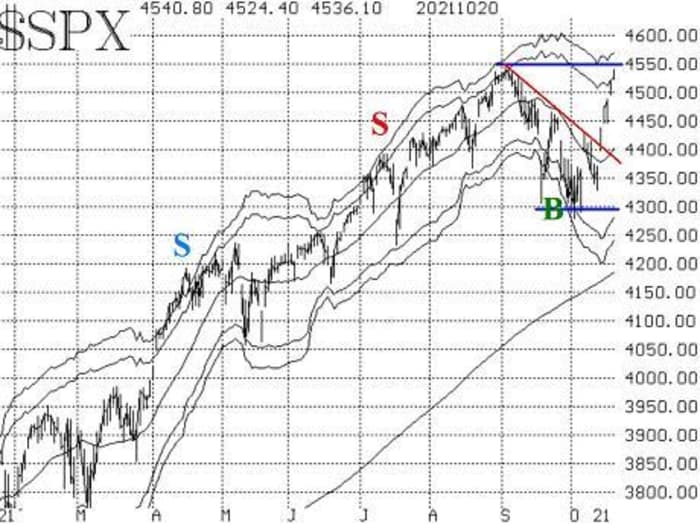
The S&P 500 index broke out above its downtrend line on Oct. 14 and has been exploding to the upside ever since. It has now reached the all-time highs (4545), and the main question is whether it has enough energy left to break on out to new all-time highs.
If not, then the S&P
SPX,
might be in a wide trading range between roughly 4300 on the downside and the all-time highs at 4545 (horizontal blue lines on the accompanying chart). There are several gaps on the SPX chart – all generated this week – and gaps are usually filled. That would argue for the “trading range” scenario.
The “modified Bollinger Bands” have been expanding over the last month or so, due to the increase in realized volatility in the stock market. The McMillan Volatility Band (MVB) buy signal (green “B” on chart) is still in effect. It will reach its target if SPX trades at the +4σ Band. That Band is in new high territory – at 4575 and rising.
Lawrence McMillan
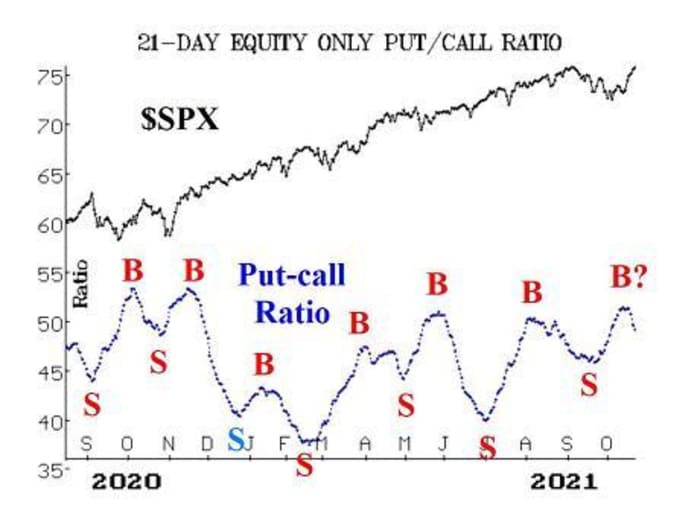
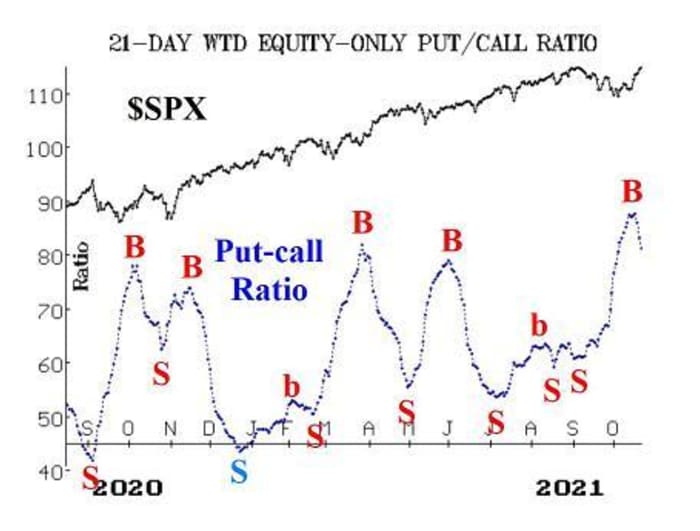
In a rather significant development, equity-only put-call ratios have rolled over to buy signals.
The weighted ratio’s buy signal is confirmed by our computer analysis, but the standard is not (even though it looks pretty obvious to the naked eye). Hence, there is a question mark on the standard chart. The weighted buy signal is coming from a height that has not been seen since April 2020. That is, a lot of pessimism in the form of put buying forced the ratio to these heights, and now the ratio has rolled over to a buy signal.
Buy signals from extremes are normally the best ones, but we shall see.
Lawrence McMillan
Lawrence McMillan
Despite some sloppiness in breadth, the breadth oscillators have stayed on buy signals since Sept. 22. Now, both breadth oscillators have moved into overbought territory, which is a good thing while SPX is rallying. If SPX breaks out to new all-time highs, it will be necessary for breadth to keep expanding to confirm the breakout.
There has been another development – in cumulative breadth. First, the NYSE cumulative advance-decline line closed at a new all-time high on Wednesday. That alone is not particularly significant. For example, the last time it did so was on Sept. 2, right at the all-time highs, and after that SPX struggled. More significant is the fact that cumulative volume breadth (CVB) has made a new all-time high for the last five trading days in a row.
When CVB makes a new all-time high, but SPX has not, it is almost always the case that SPX follows and makes a new all-time high, too. Five days ago, that was tradable information. Today it is not, since SPX has advanced to within just a few points of those highs. It is still worth noting, however.
New 52-week highs are now outnumbering new 52-week lows in all three data sets – NYSE, “stocks only,” and Nasdaq. Nasdaq has been the definite laggard in this group, and even now new highs barely outnumber new lows there. But the NYSE data is strong and is what we use as an indicator. It remains bullish for stocks.
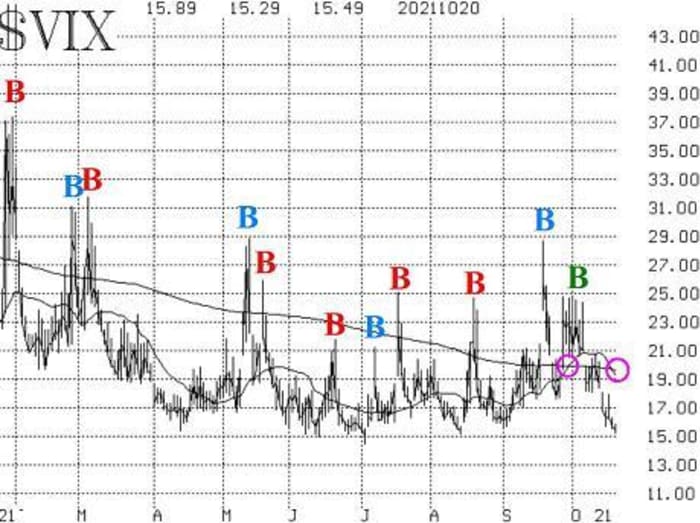
Implied volatility is generating bullish signs for stocks, too. First, the VIX “spike peak” buy signal of Oct. 1 remains in place and will do so for 22 trading days unless stopped out. Second, the trend of VIX
VIX,
has reverted to a downtrend, and a downtrend in VIX is bullish for stocks.
There are two pink circles on the accompanying VIX chart. The first was when both VIX and its 20-day moving average crossed above the 200-day MA. That was a sell signal. However, it has been stopped out by recent action. The second circle shows the date on which both of those crossed back below the 200-day, thus reinstating the downtrend in VIX.
Lawrence McMillan
Moreover, the construct of volatility derivatives remains bullish for stocks. The November VIX futures are now the front month. So the comparison we now watch is that between November and December VIX futures.
Currently, December is trading with a large 1.50 premium over November. It would be a negative if November traded above December, but that is not the case now by any means. Furthermore, the term structures of both the VIX futures and of the CBOE Volatility Indices continue to slope upward. Overall, these are bullish signs for stocks.
It is still October, although not a typical October. In a “typical” October, stocks decline (sometimes quietly sharply) for the first 20 or 25 days, and then have a strong rally at month-end. This month, we have pretty much been rallying all month.
Thus, our seasonal trade that buys “the market” near the end of October – but only if there has been a decline of at least 3.2% by SPX sometime during October – is looking less and less likely to occur. There is still time, I suppose, but SPX would have to close below 4390 before Oct. 27 to set up this trade. That is possible, but not likely.
In summary, we are no longer in a “core” bearish position but are rather trading individual systems as they occur. We would trade the “October seasonal” system if it sets up, and we would add to long positions on a breakout.
New recommendation: October seasonal buy signal
For the record, we are going to lay out this trade, although it doesn’t seem likely to occur.
IF SPX closes at least 3.2% below its highest close during October (currently, the Oct. 20 close of 4536.19),
THEN, at the close of trading on Oct. 27,
Buy 2 SPY Nov (12th) at the-money calls
And sell 2 SPY Nov (12th) calls with a striking price 10 points higher.
NOTE: SPX does have not to close on Oct. 27 at a price 3.2% below its highest October close. All that is required is that on some day, SPX closed 3.2% below its highest October close.
Follow-up: Exit the trade at the close of trading on Nov. 2. Furthermore, take a profit on half the position if SPY rises at least 5 points from where it was when you entered your trade.
New recommendation: Trading-range trade
This is an aggressive strategy to trade the top of what might be a trading range. If it does prove to be the case that SPX is in a trading range, we will exit these spreads as the gaps on the downside are filled. However, if SPX moves decisively to a new all-time high, then we will be stopped out for a loss, and we are then going to reverse and go long.
Buy 3 SPY Nov (19th) at-the-money puts
And sell 3 SPY Nov (19th) puts with a striking price 20 points lower.
Follow-up: Sell one spread each time a gap is filled on the SPX chart, even if it is filled intraday.
Sell 1 spread if SPX trades at 4488;
Sell 1 spread if SPX trades at 4439;
Sell 1 spread if SPX trades at 4372.
Otherwise, if SPX closes above 4545 for two consecutive days, we are going to reverse to the long side: exit all (remaining) put spreads and go long: Buy 2 SPY Nov (19th) at-the-money calls.
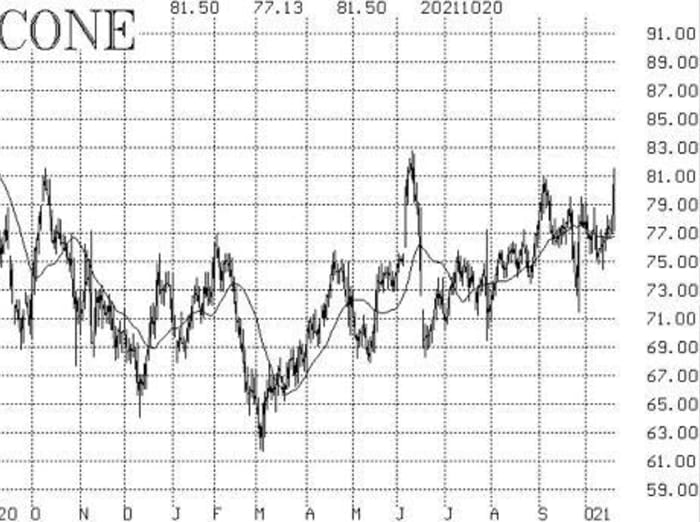
New recommendation: CyrusOne
CyrusOne
CONE,
has been a takeover rumor from time to time, and the rumors are strong again now. The stock has recently moved sharply higher, with very strong stock volume patterns and heavy call option volume.
Buy 2 CONE Nov (19th) 80 calls
At a price of 3.60 or less.
CONE: 81.50 Nov (19th) 80 calls. 3.60 offered
We will hold without a stop, while these rumors are circulating.
Lawrence McMillan
Follow-up action
All stops are mental closing stops unless otherwise noted.
Long 1 SPY Nov (19th) 430 put and short 1 SPY Nov (19th) 405 put: A spread was bought in line with the equity-only put-call ratio sell signals and then rolled out to this spread. Those put-call ratio signals have now rolled over to buy signals, so sell this spread and exit the position completely.
Long 3 LDOS Nov (19th) 100 calls: These calls were bought and then rolled, in line with a weighted put-call ratio buy signal for Leidos
LDOS,
which is still in effect. Continue to hold as long as the put-call ratio buy signal is in place.
Long 3 PCAR Nov (19th) 85 calls: These calls were bought and then rolled, in line with a weighted put-call ratio buy signal for Paccar
PCAR,
which is still in effect. Continue to hold as long as the put-call ratio buy signal is in place.
Long 1 SPY Oct (29th) 443 calls and short 1 SPY Oct (29th) 456 call: This spread was bought on Sept. 23, when SPX closed above 4430. This is the McMillan Volatility Band (MVB) buy signal. It will remain in effect until SPX trades at either of the +/-4σ bands. Touching the +4σ Band would complete the signal, and the spread should be closed. Closing below the -4σ Band would stop out the trade but would eventually set up another buy signal.
Long 1 SPY Oct (29th) 434 call and short 1 SPY Oct (29th) 446 call: This spread was bought on the VIX “spike peak” buy signal of Oct. 1. Roll the spread now: sell the spread you own and replace it with an equal number of outright long SPY Oct (29th) 451 calls. The buy signal will be in effect for 22 days or until VIX re-enters “spiking mode” (a gain of at least 3.00 VIX points over any one-, two- or three-day period, using closing prices). If it does re-enter “spiking mode,” that would set up yet another “spike peak” buy signal as soon as the next spike is completed.
Long 4 EVH Nov (19th) 30 calls: The takeover talks are supposedly still going on here, but Evolent Health
EVH,
has not really recovered from the decline on Oct. 13.
Long 2 ADP Nov (19th) 210 calls: Continue to hold as along as the put-call ratio buy signal is still in effect.
Long 2 NKE Nov (19th) 155 calls: Continue to hold as long as the put-call ratio buy signal is still in effect.
Long 4 CCJ Dec (17th) 26 calls: Stop yourself out on a close below 23.
Send questions to: lmcmillan@optionstrategist.com.
Lawrence G. McMillan is president of McMillan Analysis, a registered investment and commodity trading advisor. McMillan may hold positions in securities recommended in this report, both personally and in client accounts. He is an experienced trader and money manager and is the author of the bestselling book “Options as a Strategic Investment.”
Disclaimer: ©McMillan Analysis Corporation is registered with the SEC as an investment advisor and with the CFTC as a commodity trading advisor. The information in this newsletter has been carefully compiled from sources believed to be reliable, but accuracy and completeness are not guaranteed. The officers or directors of McMillan Analysis Corporation, or accounts managed by such persons may have positions in the securities recommended in the advisory.
