
This post was originally published on this site
The S&P 500 on Tuesday was on the verge of falling into a correction for the first time in two years, joining the Nasdaq Composite, as Russia sent troops into pro-Russian regions in Ukraine.
The S&P 500 index
SPX,
was down 1.6% at 4,279.76, well below the correction level at 4,316.91, which would represent a 10% drop from its Jan. 3 record close. A correction is commonly defined by market technicians as a fall of at least 10% (but not greater than 20%) from a recent peak.
The last time the S&P 500 entered a correction was Feb. 27, 2020, when the market was being whipsawed by fears about the outbreak of the COVID pandemic.
This time around, investors were wrestling with escalating tensions between Moscow and Kyiv, which could devolve into a full-blown war. Wall Street also was wrangling with a surge in inflation and a Federal Reserve that is bent on hiking interest rates to combat growing pricing pressures, which, incidentally, could be exacerbated by Ukraine-Russia tensions.
Read: What war in Ukraine would mean for markets as Putin orders Russian troops to separatist regions
The decline for the S&P 500 comes about a month after the Nasdaq Composite
COMP,
descended into correction. On Tuesday, the Nasdaq Composite was down 1.7%, while the Dow Jones Industrial Average
DJIA,
was off 1.8%.
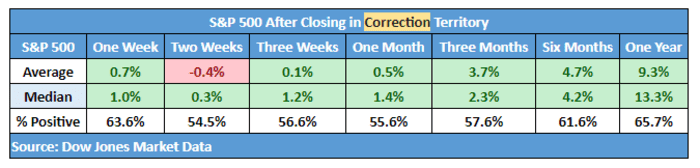
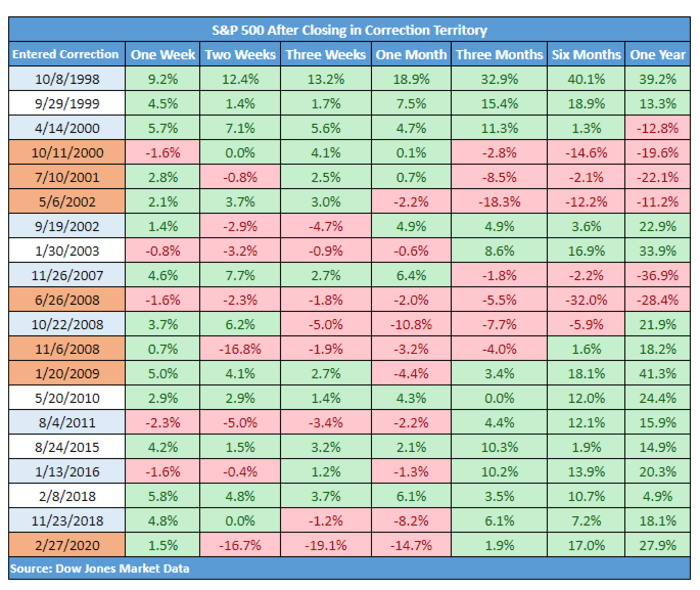
The good news for market participants is that history suggests that the market tends to eventually bounce back after the broad-market benchmark suffers a correction, gauged by data backdated to 1928.
On average, the index gains 0.7% one week following a correction but declines 0.4%, on average, about two weeks out. Thereafter, the market marches higher in the following three-week, one-month, six-month and full-year periods, according to Dow Jones Market Data.
Dow Jones Market Data
Of the past 20 corrections that have occurred in the S&P 500, including those that have morphed into a bear market, defined as a 20% decline from a recent peak, the S&P 500 has ended higher 70% of the time.
Dow Jones Market Data
—Ken Jimenez contributed to this article

