
This post was originally published on this site
The New York Sun made the case that the crash would have a minimal impact on the economy, that Main Street could be decoupled from Wall Street (…) Indeed, BusinessWeek, which had been one of the most vocal critics of the speculation on the way up, went one step further, insisting that the economy would be in even better shape now that the distracting bubble had burst. (Lords of Finance, p.361)
The quote from above is not describing the situation right now, but the sentiment in late 1929 after the US stock market – in this case exemplified by the Dow Jones Industrial Average (DIA) – crashed about 50% within just a few weeks and could recover a bigger part of its losses. Sounds familiar? If history rhymes, 2020 sure seems to rhyme with 1929.

(Source: Pixabay)
Although the situation we are in right now seems to be pretty unique – and in some aspects it definitely is – we can learn a lot from history by looking at past recessions (or depressions) as well as stock market crashes. In this article, we will focus on the Great Depression of 1929 and on several lessons, we can learn from 90 years ago. I know that many people are annoyed by the analogy to 1929, but it is just a fact that we are in the greatest economic contraction since the Great Depression and therefore looking back makes a lot of sense – especially as it is also a story of overconfidence, a story of greed and a story of wrong decisions (for 2020, only history will tell us if that is also the case).
Lesson 1: Similar Premise
When looking at the market cycle between 1921 and 1932 as well as the current market cycle that started in 2009, we see several similarities. Between August 1921 and the all-time high of 381 on September 3, 1929, the Dow Jones Industrial Average increased 468% in a little more than eight years. Between March 2009 and February 2020, the Dow Jones Industrial Average increased almost 360% while the S&P 500 (SPY) increased 410% in the same time frame.
When looking at the valuation – measured by Robert Shiller’s CAPE ratio – both cycles peaked at very similar levels. In 1929, the CAPE ratio was 32.6 while during this cycle, the CAPE ratio peaked already in January 2018 at 33 and then fluctuated around 30 for the next two years. In both cases, the indices were also trading way above the long-term trendline – in 1929 the S&P 500 was trading 79% above the long-term trendline and in 2020 it was trading even 130% higher. At this point, we already know that in 1929 as well as in 2020 we saw a rising unemployment rate – in 1929 it took several quarters, in 2020 it took only a few weeks to reach an unemployment rate of 25%. And in both cases, we also saw a severe economic contraction. While we don’t have the data yet for 2020 (only expectations of a potential 30% GDP decline in the second quarter of 2020), in 1933 the gross national product was 31.5% below its 1929 level.
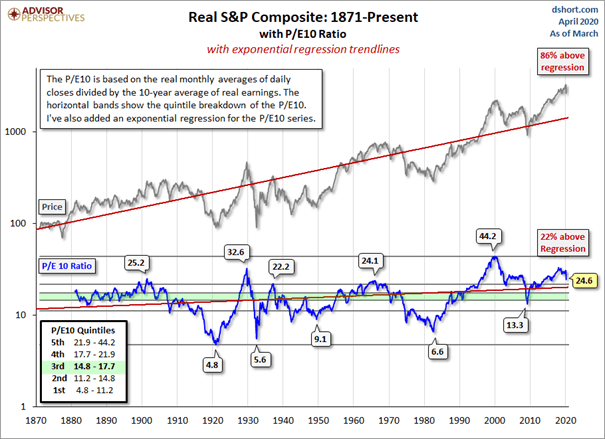
(Source: Advisor Perspectives)
A final similarity is the beginning of the correction, which happened very sudden, was in both cases extremely steep and happened just within a few weeks.
Lesson 2: Shocks Can Come Very Sudden
The second lesson we already mentioned above. Shocks can come very sudden and might take most people by surprise – a painful lesson we learned in February and March 2020. The best book on this topic is probably Nassim Nicholas Taleb’s bestseller “The Black Swan,” which is also a metaphor for such an event. Taleb is telling the story of a turkey, which is fed every day for thousand days and with every day the anticipation of getting fed and people being concerned for the turkey’s welfare grows – until it is Thanksgiving (p 40f.). While there have been warning signs before 1929 as well as 2020 and several people claiming that the stock market was extremely overvalued, the crash itself came as quite a shock and a surprise. It is also fascinating that the inverted yield curve predicted yet another recession with high accuracy and was also a warning sign. And I am aware that Taleb himself is calling the pandemic a white swan as there have been warning signs, which have been ignored by many states – Taleb himself warned of a pandemic in his book in 2007 and we all know now the famous TED talk Gates gave in 2015.
1929
When looking at the weeks and months before the cycle peak, there have been warning signs and events that contributed to the sentiment change, which occurred at some point. But most historians and people who wrote about the Great Depression agree that there was no specific event, which caused the bubble to burst. In March 1929, rumors that the Fed is going to limit or forbid speculative debt was a first shock, but this was quickly forgotten. The fall of the Hatry Group in September 1929 in Great Britain probably contributed to the sudden sentiment reversal and many British investors had to liquidate U.S. stock positions and pulled money out of the New York stock market. Stocks fell sharply on October 19, 1929 (a Saturday as stock markets traded six days a week back then), and the following week saw huge declines – especially on the famous Black Thursday and the Black Monday a few days later. As the huge declines triggered thousands of margin calls for the following day, the fact that stocks had been bought on debt also contributed to the decline. Between the first week of September and mid-November, the stock market fell about 50% before it found its first temporary bottom (the first of many). The steepest drop happened in only four weeks – between October 11, 1929, and November 13, 1929, the stock market fell 43.7%.
2020
When looking at 2020 there have been voices warning loudly that the stock market is overvalued and a recession might be upon us, but the reasons that finally brought the stock market to its knees was a surprise for everyone. As far as we know, the first infection might have happened in mid-November 2019 in Wuhan and apparently, the United States intelligence services already warned the President back then. On December 31, 2019, the WHO was informed about “cases of pneumonia of unknown etiology (unknown cause) detected in Wuhan.” At that early stage, very little information was known and especially for people outside the medical field it was difficult to assess what was going on.
But in late January, we knew much more about the virus and we could have known that this was serious. Not only was the Hubei province put under lockdown on January 24, 2020. We also knew in the last days of January that the virus already spread all over the world. Thailand had its first confirmed case on January 13, South Korea and the United States had the first confirmed case on January 20, 2020. In the next few days other countries followed: France (January 24), Canada (January 25), Germany (January 27) and Italy (January 30). On January 31, Russia, Sweden, the United Kingdom and Spain all had the first confirmed case. But it took three more weeks, before the sentiment finally changed. During the weekend following February 20, 2020 (the day on which many stock markets all over the world marked all-time highs) Italy reported that cases jumped from three confirmed cases on Friday to 79 on Sunday, Iran reported already five deaths by Sunday and South Korea had already 433 confirmed cases.
While the 1929 crash didn’t have a specific event that led to the huge decline, in 2020 it was clearly the pandemic and COVID-19. To be even more specific: The catalyst was the weekend when cases in Italy climbed exponentially and the world realized it was not just an epidemic in China, but turning into a pandemic. And like in 1929, market participants were shocked by the events and the sudden turnaround of the stock market, which led to extreme levels of panic.
Lesson 3: Markets Move In Waves
A very simple lesson one can learn from the market crash which happened between 1929 and 1932 is that the stock market always moves in waves. While a crash usually happens much faster than the bull market preceding it, the stock market never drops just like a rock. Almost all bear markets saw more than one downward wave – interrupted by bear market rallies (bullish waves). And depending on what should count as a wave, we saw six or seven downward waves and five or six corrections of these downward waves in the years between 1929 and 1932.
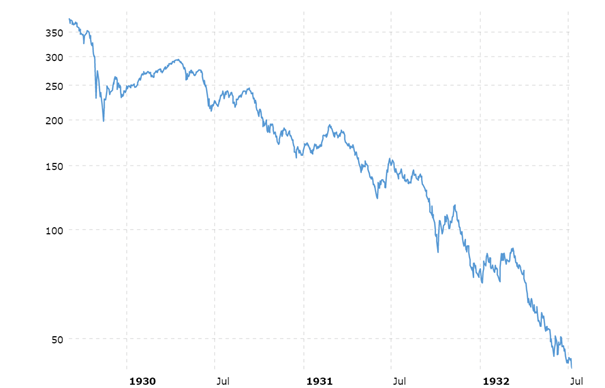
(Source: Macrotrends)
As corrections happen in waves, it is not surprising that a bearish wave is followed by a bullish correction. Keeping that in mind, everybody should have known that at some point the (first) bearish wave would come to an end (in our case: March 23, 2020) – even if we assumed that this was not the cycle low. In 1929, the 50% decline was followed by a 52.5% rally lasting from November 1929 till April 1930 before the next downward wave took the Dow Jones Industrial Average 28% lower again and in October 1930 the index broke the November 1929 low and continued its decline. In the first few months of 1930, investors and market observers assumed the worst was over – including President Hoover – which is exemplified by the quote at the beginning of the article.
In 2020, a 36% decline of the S&P 500 was followed by a 36% increase so far. The picture for the Dow Jones Industrial Average is similar. The Nasdaq-100 (QQQ), however, could almost reach its previous all-time high again and a 32% decline was followed by a 43% increase since the end of March. When looking at the current situation, not only does it look very similar to 1929 (knowing very well that this is no guarantee for any future development), but the phases of the bubble according to Jean-Paul Rodrigue come to mind. Not only are people literally demanding to return to normal again, the theory of the quick, V-shaped recovery is also based on it. Assuming I am right, we saw a classical bull trap in March 2020 for mid-term and long-term investors (short-term investors might have been able to generate huge profits) and are now in the “Return to normal” phase.
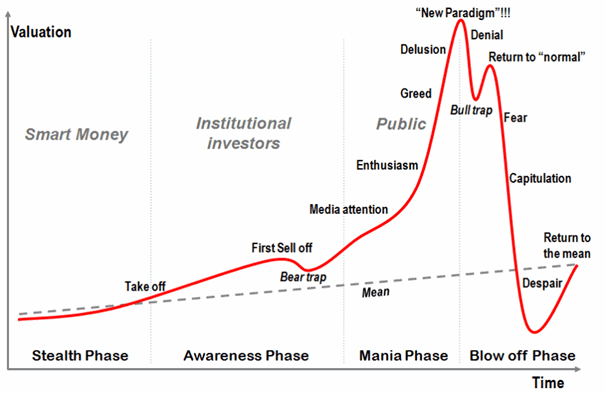
(Source: Phases of the bubble by Jean-Paul Rodrigue // Wikipedia)
And as I have described above, we were clearly in the denial phase at the beginning. I myself published an article at the beginning of March, called “Buy the dip: 8 picks for March” and although I assumed for quite some time that we will reach the cycle peak, it would be a bold lie claiming that I expected a crash like we witnessed in March 2020. But for my own rehabilitation I have to point out that I finished the article with the following quote:
In my opinion, we are still closer to the peak of the market than we are to the cyclical bottom (…) We should keep in mind that we could face a much steeper correction as a global downturn and recession might be upon us, and in such a scenario, these stocks will also decline.
Lesson 4: Markets Are Complex Systems
It is very simple: Financial markets – like many other social systems – are complex systems. Everybody claiming otherwise has either no clue or the motives should be questioned.
Events – no matter if we are talking about political events, laws or developments of the stock market – never happen in isolation. In 1929, an economy was suddenly hit, which appeared to be in a good condition (similar to the economy in 2020). And in November 1929, after a 50% correction, the problem of an overvalued stock market was probably resolved. But there were consequences like a changing sentiment and shattered confidence of investors and management (leading to lower investments), people withdrawing money and selling assets, increasing unemployment and lower spending. And if a country doesn’t manage to escape that death spiral (fiscal stimulus, restoring confidence, etc.) it is on its way to a depression – like in 1932 and 1933, when GDP was more than 30% lower compared to 1929. And with profits declining drastically, the valuations of November 1929 suddenly were extremely high and a further decline seemed justified.
The message is very simple: Don’t treat this shock to the economy as an isolated event, which can be “cured” within a few months. We will neither cure this pandemic within a few months (as it seems highly unlikely that a vaccine will be available in 2020) and we will witness economic consequences. We will see declining revenue and declining earnings for companies, we will see bankruptcies, almost 40 million people are unemployed right now leading to lower disposable income, which will lead to lower revenue and profit for companies. Bankruptcies or credit defaults might lead to massive losses for banks, which will grant fewer credits (that other companies might need to survive). Banks collapsing will lead to bank runs, which could force even solid banks to sell assets in order to provide this liquidity and so on.
Part of the reason for the extent of the world economic collapse of 1929 to 1933 was that it was not just one crisis but, as I described, a sequence of crisis, ricocheting from one side of the Atlantic to the other, each one feeding of the ones before, starting with the contraction in the German economy that began in 1928, the Great Crash on Wall Street in 1929, the serial bank panics that affected the United States from the end of 1930, and the unraveling of European finances in the summer of 1931. (Lords of Finance, p. 497f.)
My goal here is to illustrate that the economy itself is already an extremely complex system, which is embedded as social system in what we call society with several other social systems – like the political system, the scientific system, the legal system or medical system. Additionally, there are several institutions (like the IMF or the WHO) and billions of people. And all together create an extremely complex system with feedback loops, unintended consequences, ripple effects and so on. If you want to learn more about this theory – the sociological systems theory – I recommend reading the writings of Niklas Luhmann, which are in part also available in English (the book “Social Systems” would be a good starting point for this complex theory).
Lesson 5: Every Cycle Is Different
So far, we rather looked for similarities between 1929 and 2020. And while certain patterns repeat themselves over and over again, people and organizations are usually learning systems and are trying to avoid past mistakes and make improvements. And despite many similarities and patterns, we also have to pay attention to those aspects that are different.
First of all, in 1929 almost every major economy was still on the gold standard. In the coming years, many countries abandoned the gold standard, but at the beginning of the crisis the currency was linked to gold, which limited the capacity to act for every central bank. Many of the monetary policy tools the Fed was using in 2008 and is using again in 2020 were simply not possible or more complicated with the United States still being on the gold standard in 1929. I don’t want to argue for or against the gold standard at this point – just pointing out that being on the gold standard is making a huge difference.
The historical circumstances also play a very important role. While the world is now 11 to 12 years after the Financial Crisis, the world back then was 11 years after World War I. While the high debt levels are one of the similar patterns (high debt levels after the world war and high debt levels right now after the Financial Crisis), we have to take into consideration that Germany – one of the major economies – was facing huge economic problems as well as the hyperinflation in 1923. And Germany was also faced with extremely high reparations – in hindsight, we know that the reparations were more than Germany could take and created huge economic, political and social problems for Germany which contributed to the rise of the NSDAP and the Nazis resuming power in 1933. Many countries had also abandoned the gold standard during the world war and returned in the years after the war. But for many countries – like the United Kingdom – this created huge problems. And of course, the countries which fought a costly and deadly war for more than four years – especially Germany, France and Great Britain – had to finance the war resulting in extremely high debt levels.
It is wrong to say that the Fed and the government (under President Hoover) didn’t do anything, but in hindsight, it was not nearly enough and both could have done more. President Hoover as well as the Fed probably made the crisis worse as many people argue that it was not possible to prevent the recession, but it might have been possible to prevent the depression. One example is the reaction of the Fed in 1930:
In the early summer [1930], the Fed stopped easing. It proved to be a mistake. For just as it went on hold, the economy embarked on a second down leg, industrial production falling by almost 10 percent between June and October. There is some debate about Harrison’s reasons. Some argue that he thought he had done enough. (Lords of Finance, p. 366)
Or in 1932, the Banking Act made it possible for the Fed to purchase government bonds (what we call quantitative easing now) and till June 1932, the Fed had bought about $1.5 billion in government securities. Inflation-adjusted this is an amount of $28 billion, which is looking minuscule compared to the trillions of dollars the Fed is spending now.
In 2020, the world is not on the gold standard and therefore the power of the Fed actually seems limitless and at least in theory, the Fed will not run out of ammunition. And while the world is faced with extremely high debt levels, it is not faced with the burden of reparations. And the Fed actually acted very quickly this time and the amounts of money are much higher (see example above). So far, many people seem to be convinced that the Fed and the government might have prevented a depression and so far, it was enough to stop the decline in asset prices.
Conclusion
The intention of this article was to learn from 1929, assuming this is possible in such a short article (for further reading see literature recommendations below). I don’t want to indicate that 2020 will be similar to 1929, but considering the magnitude of the shock, we shouldn’t rule it out. Right now, we simply don’t know what will happen as it is depending on millions of factors (the actions organizations like the Fed or big corporations are taking, political decisions, the behavior of people regarding social distancing or the virus itself).
Especially, the reaction of the Fed (and the government) had a huge (positive) impact and might have shaped the path for the next few quarters in a positive direction. I also don’t think we will see a 90% decline in stock prices again, but don’t want to rule out a drop to the 2009 lows again (reflecting an 80% decline). I don’t consider that scenario very likely, but only time will tell us. And we should think in probabilities, learn from history, consider different scenarios and not just bet on a quick V-shaped recovery.
Literature
Dalio, Ray: Big Debt Crisis. Bridgewater. 2018 (especially Part II: Detailed Cases Studies, p. 47-102).
Liaquat, Ahamed: Lords of Finance. The Bankers who broke the world. Penguin Press. 2009.
Luhmann, Niklas: Social Systems. Stanford University Press. 1995.
Taleb, Nassim Nicholas: The Black Swan. The Impact of the Highly Improbable. Random House. 2007.
Disclosure: I/we have no positions in any stocks mentioned, and no plans to initiate any positions within the next 72 hours. I wrote this article myself, and it expresses my own opinions. I am not receiving compensation for it (other than from Seeking Alpha). I have no business relationship with any company whose stock is mentioned in this article.

