
This post was originally published on this site
The stock market, as measured by the S&P 500 Index
SPX,
has had trouble holding breakouts to new highs.
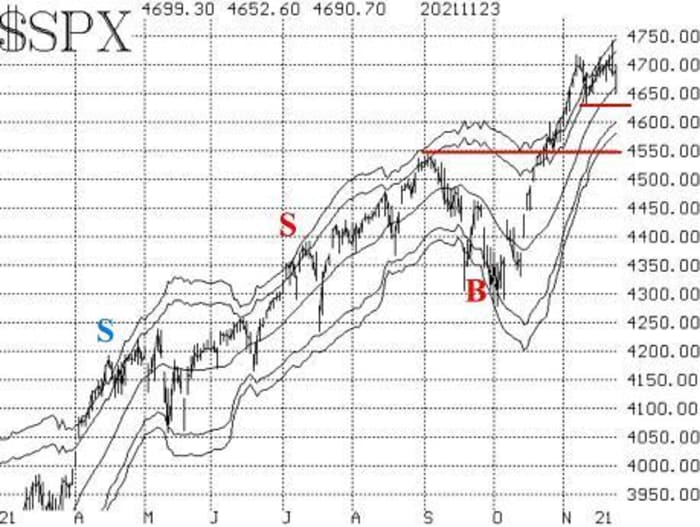
Seven times this month, it has probed above 4705 points — including what seemed to be (at the time) a strong move to 4743 on Nov. 22. But each time, it has fallen back to close below 4705. As a result, that is a resistance area until SPX can close above that level. There is support at 4630.
The ”classic” modified Bollinger Band sell signal remains in effect, but a full-blown McMillan Volatility Band (MVB) sell signal will not take place until SPX closes below 4630.
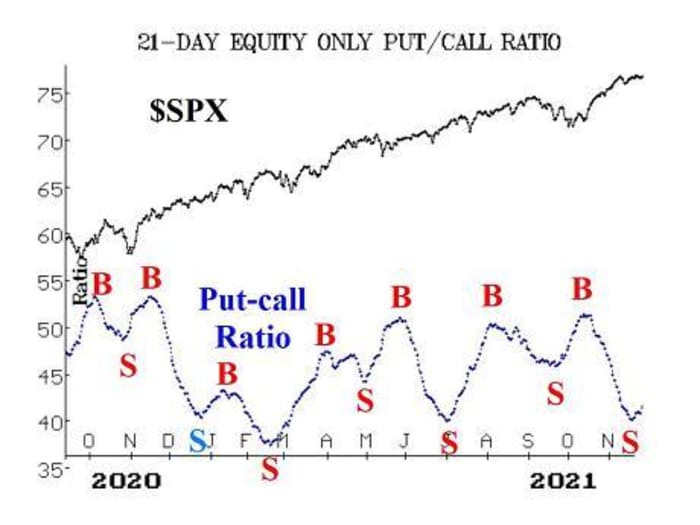
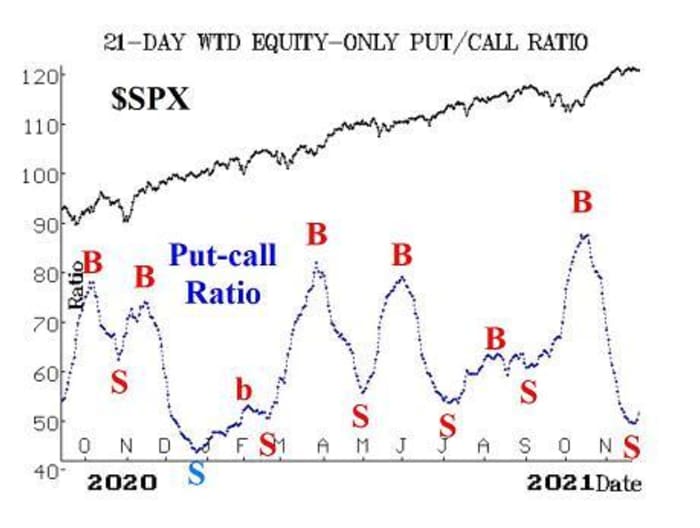
Both equity-only put-call ratios remain strongly on a sell signals. This is now obvious to the naked eye, after the computer analysis programs “called” these sell signals last week. They will remain bearish until they roll over and begin to trend downward again.
Breadth has been quite negative lately, but surprisingly not very negative yesterday (Nov. 23), when SPX was down sharply for most of the day. The breadth oscillators remain on sell signals, but a couple of days of positive breadth could easily generate a buy signal. Cumulative breadth indicators, meanwhile, are not near all-time highs, having backed off over the past couple of weeks.
New 52-week lows on the NYSE took charge over new 52-week highs. So this indicator is now on a sell signal, too. It will continue to be until new highs lead new lows for two consecutive days. As has been the case for some time, “stocks only” and Nasdaq data show a much more negative situation as new lows are dominating there.
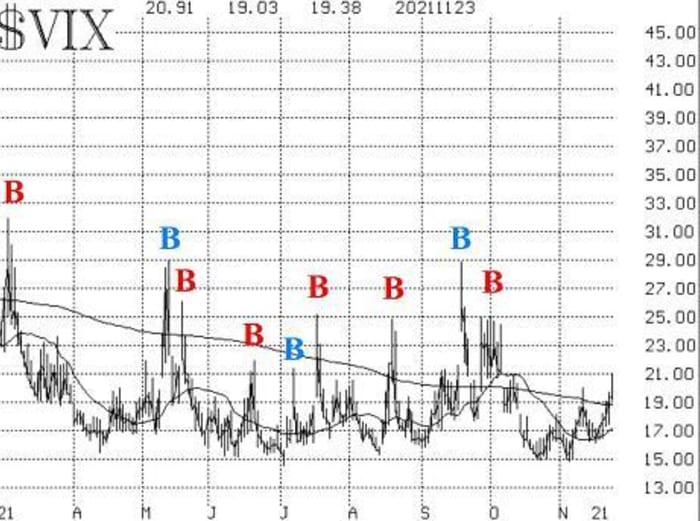
VIX seems to be trying to rally, but it is not “spiking.” It’s oozing upward. As a result, even though VIX is above its 200-day moving average, we do not consider this to be a sell signal. A sell signal would be generated if both VIX and its 20-day moving average closed above the 200-day MA. The construct of volatility derivatives continues to be positive, as the VIX futures are trading at a premium to VIX, and the term structure slopes upward.
Finally, we are now on the brink of a seasonally bullish period — which we trade with IWM
IWM,
options (see the Market Insight section). IWM has been the worst-performing index this month, but that means we won’t be paying up for it when we buy calls this afternoon. Last year, IWM had a very strong December.
Overall, we retain the “core” bullish position, even though SPX is struggling and its internal indicators (breadth, put-call ratios, and new highs vs. new lows) are all on sell signals. A close below 4630 would change that bullish stance. Meanwhile, we will continue to trade confirmed signals around that “core” position, as they take place.
New conditional recommendation: MVB sell signal
A McMillan Volatility Band (MVB) sell signal is a re-confirmation of the “classic” modified Bollinger Band sell signal. The “classic” signal has occurred, so now we are merely looking for the confirmation, which will come on an SPX close below 4630.
IF SPX closes below 4630,
THEN Buy 1 SPY Dec (17th) at-the-money put
And Sell 1 SPY Dec (17th) put with a striking price 20 points lower.
If this MVB sell signal is confirmed, it would then be stopped out by a close above the +4σ Band. We will update that condition weekly.
Market Insight: Post-Thanksgiving buy signal
Thanksgiving sets off a number of seasonal patterns, although we combine several of them for one trade. The three main seasonal patterns are:
1. Post-Thanksgiving bullishness: buy the market at the close of the day before Thanksgiving and hold into mid-December.
2. The January effect: which used to take place in January, but because of traders front-running the system, it now takes place in December. Small caps outperform big caps during this time, so buy the small-cap indices (Russell 2000 – RUT; IWM, for example).
3. The Santa Claus rally, which encompasses the last five trading days of one year and the first two trading days of the next year.
Several years ago, we found that these three systems piggy-back on each other quite nicely. The most efficient trade is to buy small-caps on the day before Thanksgiving and hold them through the second trading day of the next year. Of course, one would roll, take partial profits, and so forth, should those opportunities present themselves.
Dating back to 1992, there have been 23 winning trades and 6 losing trades. The average year has seen a 2.9% gain in RUT over the roughly six-week time period. That’s not on a par with the Oct or Jan seasonal trades, but it is still a good profit.
Last year’s trade was our best ever in terms of RUT points (not percent) – a gain of 134.1 points. The worst year, as I’m sure you can guess, was the one beginning on Thanksgiving 2018 (just prior to the worst December in history) – a loss of 157 RUT points. Since we trade this system with options, we didn’t lose 157 points, but we still had a loss nonetheless.
In case you’re wondering, if we had used SPX instead of RUT in this system, the average trade would have been a gain of 2.1% over the same time period.
At the close of trading today (Wednesday, Nov. 24),
Buy 3 IWM Jan (15th) calls, one strike in-the-money.
We will be exiting the trade on Jan 4th (the second trading day of 2022), so there may be some time value left in these options then. Meanwhile, if IWM rises 7 points from where it was when you entered the trade, roll your calls up to the at-the-money strike (remaining in the Jan 15th expiration).
Follow-up action:
All stops are mental closing stops unless otherwise noted.
Long 3 PCAR Dec (17th) 90 calls: these calls were bought and then rolled, in line with a weighted put-call ratio buy signal for PCAR, which is still in effect. Roll to the Dec (17th) 90 calls now. We will continue to hold as long as the put-call ratio buy signal is in place.
Long 0 EVH Nov (19th) 30 calls: these calls expired worthless.
Long 2 ADP Dec (17th) 235 calls: the put-call ratio buy signal remains in effect here, and we rolled up when ADP traded at 230.
Long 4 CCJ Dec (17th) 26 calls: the closing stop remains at 24.50.
Long 2 expiring SPY Nov (26th) 465 calls: SPY calls were bought on the upside breakout to new highs (after reversing from a long put bear spread) and then rolled higher. Raise the closing stop to 464, basis SPY. Roll to the SPY Dec (17th) at-the-money calls.
Long 2 expiring SPY Nov (26th) 465 calls: is our “core” long position. Raise the closing stop to 464, basis SPY. Roll to the SPY Dec (17th) at-the-money calls.
Long 0 AUPH Nov (19th) 30 calls: these calls expired worthless. This week AUPH Announced plans for a secondary offering of stock, and the stock price was crushed. Traders interpreted that news as meaning that a takeover is not in the cards.
Long 1 SPY Dec (10th) 469 put and Short 1 SPY Dec (10th) 449 put: this spread was bought in line with the breadth oscillator sell signal, which remains in effect. We will update the status of that signal weekly in this report.
Long 1 SPY Dec (10th) 469 put and Short 1 SPY Dec (10th) 449 put: this spread was bought in line with the equity-only put-call ratio sell signals. This trade will be stopped out if the ratios begin to fall again. We will monitor the situation and report it weekly.
Long 1 SPY Dec (10th) 469 put and Short 1 SPY Dec (10th) 449 put: this spread was bought in line with the New Highs vs. New Lows sells signal. Stop yourself outif NYSE New Highs outnumber NYSE New Lows for two consecutive days.
Long 2 CMS Dec (17th) 60 calls: were bought on November 22nd, when the stock finally closed above 61.50. This purchased is based on the weighted put-call ratio buy signal in CMS, and that buy signal remains in effect.
Send questions to: lmcmillan@optionstrategist.com.
Lawrence G. McMillan is president of McMillan Analysis, a registered investment and commodity trading advisor. McMillan may hold positions in securities recommended in this report, both personally and in client accounts. He is an experienced trader and money manager and is the author of the best-selling book, Options as a Strategic Investment.
Disclaimer: McMillan Analysis Corp. is registered with the SEC as an investment advisor and with the CFTC as a commodity trading advisor. The information in this newsletter has been carefully compiled from sources believed to be reliable, but accuracy and completeness are not guaranteed. The officers or directors of McMillan Analysis Corporation, or accounts managed by such persons may have positions in the securities recommended in the advisory.

