
This post was originally published on this site
The price action in the retail preferred stock market has allowed investors to separate the wheat from the chaff, so to speak. Some stocks have reacted to this drawdown by dropping and remaining at depressed prices, reflecting a permanent shock to their financial prospects. Other stocks, on the other hand, suffered a similar initial fall but managed to retrace much of the drop, reflecting their resilience or a “bend, not break” characteristic. In this article we take a look at these stocks. We also highlight a number of individual securities such as:
- 5% GAMCO Global Gold & Income Trust (GGN.PB)
- 7.5% Wells-Fargo Series L (WFC.PL)
- 4.9% Public Storage Series E (PSA.PE)
Measuring Resilience
Broadly speaking there are (at least) three different ways investors can find higher-quality preferred stocks.
The first method is to do the fundamental research on individual stocks and invest in those that pass muster. This approach is likely to yield a portfolio that best suits an individual investor’s risk tolerance and fundamental views. The difficulty with this approach is obvious – to parse through financial statements for hundreds of issuers across many diverse sectors takes not only unusual skill but also a time commitment requiring a full-time research team.
The second method of approaching the question of selecting higher-quality stocks is to rely on rating-agencies. Although the agencies are not perfect given their terrible track record of rating asset-backed securities prior to the financial crisis, they do a pretty good job of rating corporate issuers. One downside of this is that roughly half the retail preferred market is unrated which leaves out quite a big chunk of the market. And it is this part of the market that is likely to offer the best risk-reward if individual investors rely on ratings to make their allocations since unrated stocks should see reduced demand.
The third method which we use in this article is a kind of a “proof is in the pudding” approach. In this method we look at price action to find stocks that have behaved in a more resilient fashion through the drawdown. There are many different metrics to choose from such as the extent of the price drawdown, price volatility and others. In this article we select stocks that have been able to largely retrace their drawdowns, showing decent total return over the past 3 months.
This method is obviously not perfect. It may miss some special situations, potential bargains, stocks with lower liquidity or stocks that have fallen as a result of interest rate shifts rather than credit concerns. However, there are many advantages as well. First, it’s universal – it captures the entire retail preferreds market. And secondly, it’s unlikely to offer up false positives, that is, stocks that have poor financial resilience but have somehow managed to retrace the bulk of their drawdown. So, all in all, we think this is a good starting point.
Setting Our The Screen
We use the following criteria in our screen all of which we track daily on our service:
- 3-Month Total Return > -5%
- Yield-to-worst above 4.5% but below 8%
- Annual Drawdown > -35%
The 3-Month total return is the primary screen in this approach and is designed to select the stocks have largely retraced their drawdowns. The return metric is not annualized and the figure of -5% is chosen to have a reasonable number of candidates as well as be roughly equivalent to a year’s worth of income. The median 3M return of the retail preferreds universe is -8.4% and the average is -12.8%.
The yield-to-worst range of 4.5% to 8% is there to screen out stocks with yields that are too low for most income investors as well as a handful of very high yields that have largely idiosyncratic stories and would skew the results.
Finally, the annual drawdown figure is to further screen the stocks. The first two metrics produce 91 stocks which is a large number to digest. The annual drawdown further constrains the list by leaving out stocks with very large drawdowns. We maintain two different drawdown metrics for all preferreds on the service: stock drawdown and issuer drawdown. The stock drawdown is the largest 1-year price drop in the last five years for the given stock and the issuer drawdown is the largest 1-year price drop across all series of a given issuer. The latter metric is more useful as some series have only begun trading recently and so would flag up with very small drawdowns by virtue of having missed the worst of the drawdown.
A Look At The Results
The following chart presents the results.
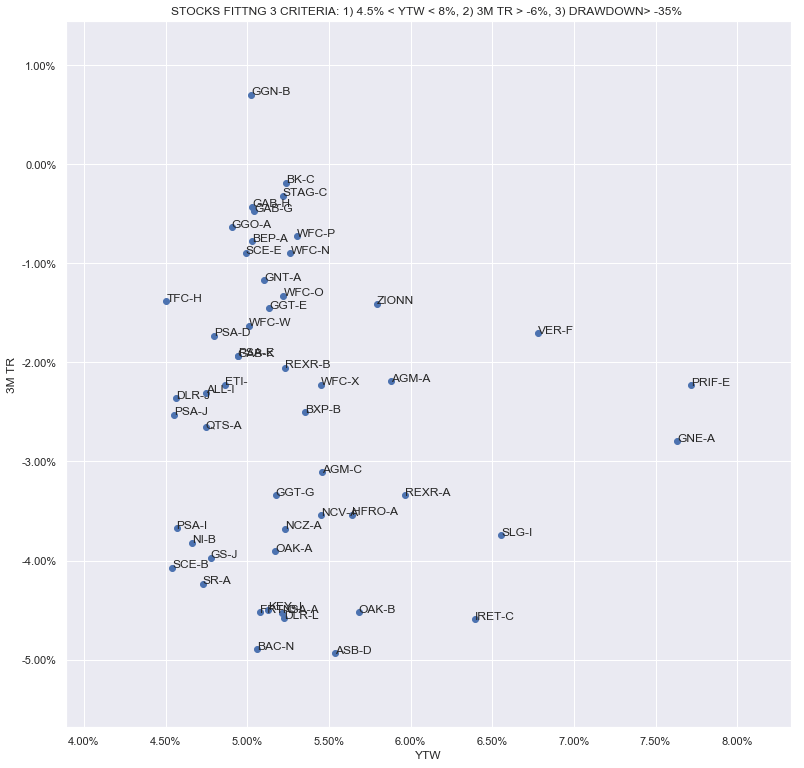
Source: Systematic Income
What does this chart tell us? There are some usual suspects:
CEF preferreds, in particular the Gabelli equity CEF preferreds. There are still a number of series with yields-to-worst of around 5%, very resilient total returns of close to zero as well as impressive asset coverage. We would highlight the 5% GAMCO Global Gold & Income Trust (GGN.PB). Although the series is callable now, it has been callable for over two years and its clean price is a bit below $25 so if it is called now there would be a small windfall to investors. We track live asset coverage for the CEF preferreds and we estimate the coverage of GGN.PB to be over 900% meaning that the NAV has to fall around 90% for the preferreds to not be fully covered by assets.
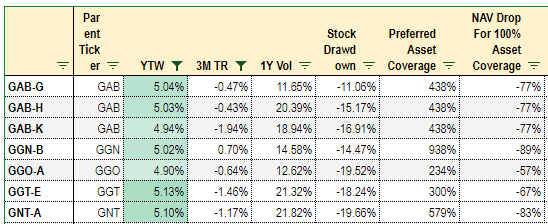
Source: Systematic Income Investor Preferreds Tool
Bank preferreds have generally held up well also. The chart includes some of the largest banks such as Bank of America and Wells-Fargo as well as more regional players such as Zions and Key Bank.
Wells-Fargo boasts a large number of series with different coupon characteristics. In the table below we compare three different series: the 7.5% busted convertible Series L (WFC.PL), the highest-yielding fixed-to-float 5.85% Series Q (WFC.PQ), and the highest-yielding fixed series 5.50% Series X (WFC.PX).
Although WFC.PQ has the highest yield-to-worst, besting WFC.PL by 0.26%, investors should keep in mind that at current Libor forwards the yield will reset to just 3.63% in 2023. So, investors in this stock are taking an implicit view that 3M Libor, or its effective replacement, will rise significantly by this time which is certainly a bold view.
Furthermore, as WFC.PL is not callable it does not feature the negative convexity of callable stocks meaning its price can continue to rise on further drops in interest rates. Of course, interest rates are already quite low but the 30-year Treasury yield is still trading around 1.4% leaving a decent amount of room between it and zero.
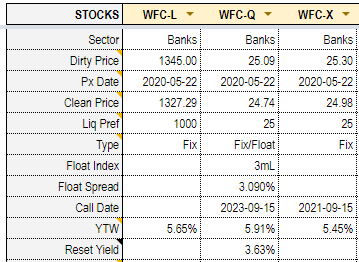
Source: Systematic Income Investor Preferreds Tool
In higher-quality utilities and REITs we have the usual suspects like Public Storage (PSA) and Spire (SR) preferreds. Public Storage boasts interest and preferred dividends EBITDA coverage of around 8x versus around 3x for the broader REIT sector and a leverage of well below the rest of the sector.
Most of the Public Storage series are trading at YTW below 4% making series selection a key task for investors. Among the 12 series we like the 4.9% Series E (PSA.PE) at a 4.94% YTW and a late 2021 call date. For investors looking to lock in yields for as long as possible we like the 4.7% Series J (PSA.PJ) among the three 2024 series at a 4.54% YTW. For investors looking for a high stripped yield with small amount of call risk we like the 5.2% Series W (PSA.PW) which is currently callable and trading just above “par” in clean price terms.
Conclusion
Investors have different ways to identify resilient preferred stocks such as detailed fundamental research, credit ratings and price action. We think the latter approach provides a good balance of stock coverage and quality signal strength. Although no crisis is the same and stocks that have remained resilient through this one may not come off as well in the next one, the depth and breadth of the macro crash provides a good starting point for identifying quality securities featuring a “bend, not break” profile.
Check out Systematic Income and explore the best of the fund, preferred and baby bond markets with our powerful interactive investor tools.
Identify the most attractive CEFs and track the entire market with our evidence-based bespoke metrics. Pick up the best preferred stocks and baby bonds that fit your criteria.
Get investment ideas and sector views from our Strategic Allocation Framework and Income Focus List.
Check us out on a no-risk basis – sign up for a 2-week free trial!
Disclosure: I am/we are long WFC.PL, GGN.PB. I wrote this article myself, and it expresses my own opinions. I am not receiving compensation for it (other than from Seeking Alpha). I have no business relationship with any company whose stock is mentioned in this article.

