
This post was originally published on this site
Property tax collections hit the highest since at least 2009 as the housing market stayed hot through the COVID-19 downturn, according to a report out Wednesday.
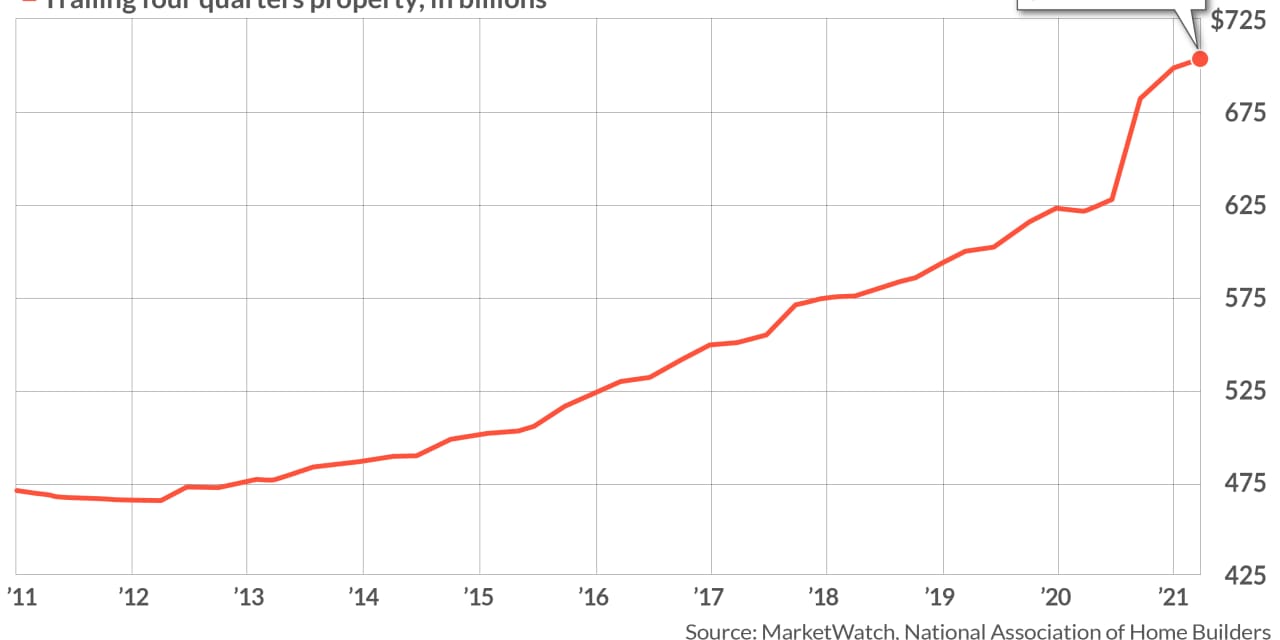
The analysis, from the National Association of Home Builders, uses Census Bureau quarterly tax data to show that property owners paid $703.5 billion in the four quarters ending in Q2 2021. That is up 13.2% for the year, and marked the first time an annual increase topped 10% since the end of the 2007-09 Great Recession.
The housing market stayed buoyant even as much of the rest of the economy took a hit during the pandemic. The closely watched S&P CoreLogic Case-Shiller National Home Price Index gained 19.7% for the year in July, marking the fourth straight month of record price gains, as wealthier white-collar workers kept their jobs and upgraded their living spaces.
As NAHB notes, tax revenues for state and local governments can be erratic, particularly in a period of unknowns like the pandemic.
See: In one chart, how U.S. state and local revenues got thumped by the pandemic—and recovered
“In contrast,” the report says, “property tax collections have proven relatively stable, reflecting the long-run stability of tangible property values as well as the smoothing effects of lagging assessments and annual adjustments.”
Property taxes made up 38.2% of state and local tax receipts for the four quarters ending Q2 2021. It is the biggest segment of revenues, followed by individual income and sales taxes. Property n this case refers to owner-occupied homes, rental housing, commercial real estate, and agriculture, NAHB notes.
See: U.S. state tax revenues end 2021 higher than 2019, report finds


